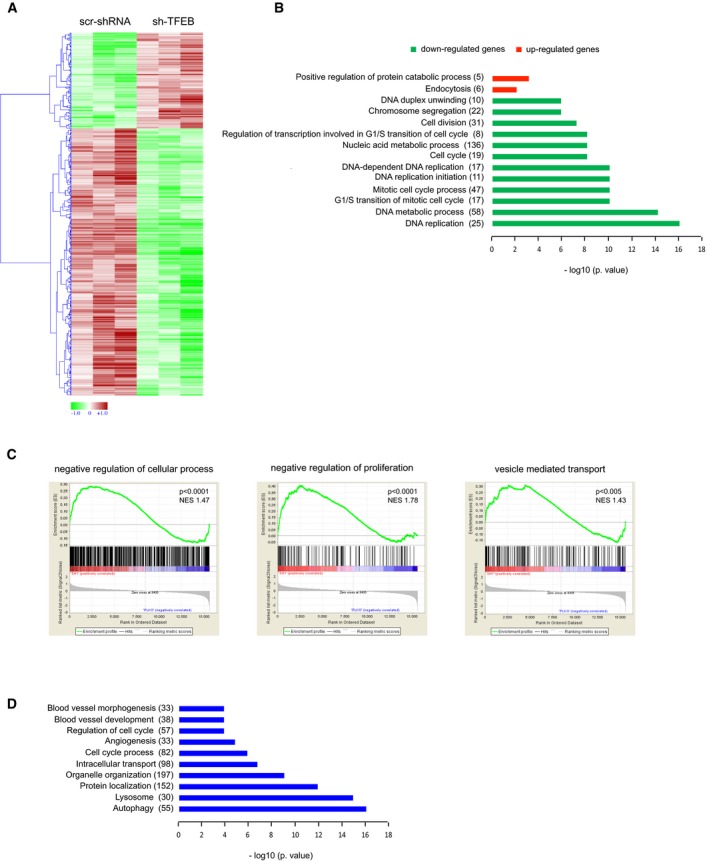
Figure 3. TFEB gene regulation in human ECs.

- Heatmap showing unsupervised hierarchical clustering of human differentially expressed genes between human scr‐shRNA and sh‐TFEB ECs. Red: up‐regulated genes; green: down‐regulated genes.
- Selection of enriched functional GO categories by DAVID analysis in differentially expressed genes between human sh‐TFEB and scr‐shRNA ECs. GO analyses were performed individually on down‐ or up‐regulated genes using DAVID tool (biological process). GO terms are ranked by P‐value corrected by Benjamini‐Hochberg method, and the number of genes is indicated.
- Selection enriched of Molecular Pathways by GSEA of microarray data comparing human sh‐TFEB and scr‐shRNA ECs. Normalized enrichment scores (NESs) and P‐values are reported.
- Selection of enriched functional GO categories by DAVID analysis on ChIP‐seq data set performed in human ECs overexpressing TFEBS142A. GO analyses were performed using DAVID tool (biological process). GO terms are ranked by P‐value corrected by BH method, and the number of genes is indicated.
