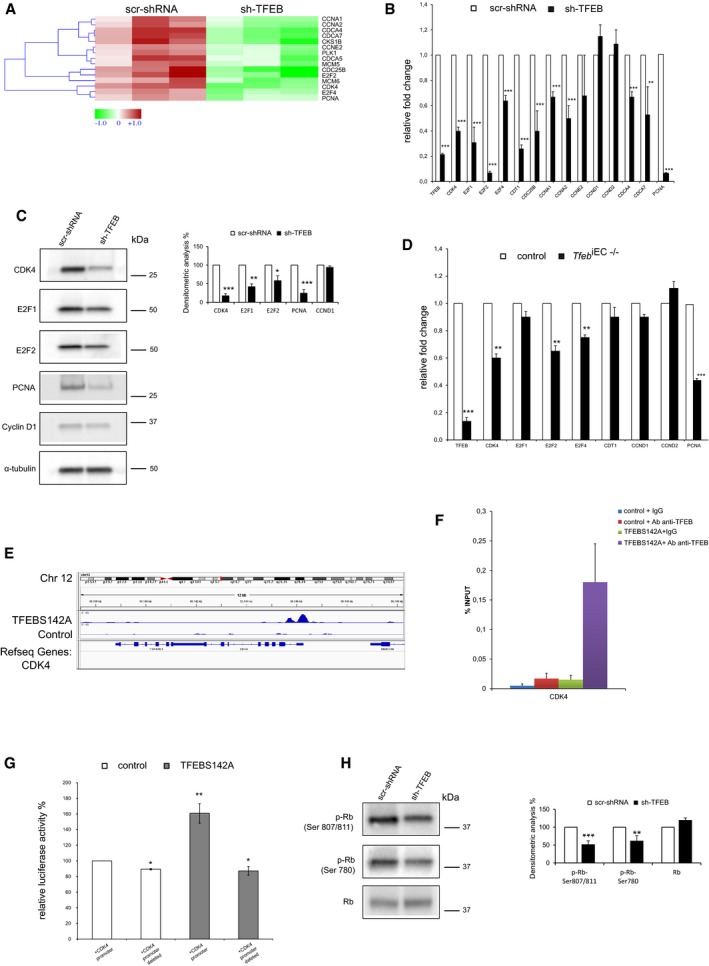
Figure 4. TFEB regulates cell cycle genes.

-
A–C(A) Heatmap, (B) qPCR, and (C) immunoblots showing the differentially expressed cell cycle‐related genes between scr‐shRNA and sh‐TFEB ECs. (A) Red: up‐regulated genes; green: down‐regulated genes. (B) Data are expressed as relative fold‐change compared with the expression in scr‐shRNA cells after normalization to the housekeeping gene TBP (n = 3, mean ± SEM; **P < 0.001 and ***P < 0.0001 by Student's t‐test). (C) Immunoblots of total lysates from scr‐shRNA and sh‐TFEB ECs probed with specific Abs. The bar graph shows the densitometric analysis expressed as the ratio between the cell cycle genes and α‐tubulin (n = 3, mean ± SEM; *P < 0.01, **P < 0.001, and ***P < 0.0001 versus scr‐shRNA by Student's t‐test).
-
DModulation of cell cycle genes expression in the lung ECs derived from control and Tfeb iEC−/− mice. Data are expressed as relative fold‐change compared with the expression in ECs of control mice after normalization to the housekeeping gene TBP (n = 3, mean ± SEM; **P < 0.001 and ***P < 0.0001, by Student's t‐test).
-
E–GAnalysis of TFEB binding and modulation of the CDK4 promoter in human ECs. (E) Representative snapshot of TFEB binding on CDK4 in human ECs. (F) ChIP was performed using digested chromatin from control ECs and TFEBS142A ECs incubated with IgG (indicated in the bar graph as “+IgG”) or with Ab anti‐TFEB (indicated in the bar graph as “+Ab anti‐TFEB”), followed by qPCR for CDK4. Bar graph shows the percent enrichment (n = 3, mean ± SD). (G) Analysis of TFEB modulation of CDK4 promoter in human ECs. Bar graph shows the relative luciferase activity % evaluated in control and TFEBS142A human ECs after transfection of CDK4 full promoter and CDK4 promoter deleted of TFEB binding site (n = 3, mean ± SEM; *P < 0.01 and **P < 0.001 by Student's t‐test).
-
HModulation of Rb protein in sh‐TFEB ECs. Immunoblots of total lysates from scr‐shRNA and sh‐TFEB ECs probed with phospho‐Rb and total Rb Abs. The bar graph shows the densitometric analysis of the immunoblotting expressed as % of sh‐TFEB versus scr‐shRNA and the ratio between phospho‐Rb and total Rb in the different conditions (n = 3, mean ± SEM; **P < 0.001, ***P < 0.0001 versus scr‐shRNA by Student's t‐test).
Source data are available online for this figure.
