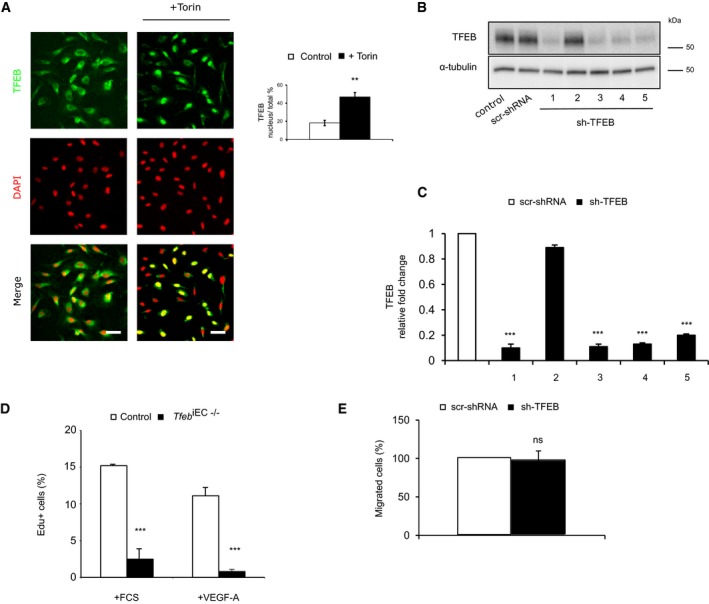
Figure EV4. TFEB expression and regulation in human ECs. Additional effects of Tfeb deletion on human ECs.

-
AmTOR inhibition activates TFEB nuclear translocation. Representative images of human ECs under basal conditions or after Torin stimulation (100 nM, 1 h) stained with anti‐TFEB Ab and DAPI (scale bars: 20 μm). Bar graphs indicate the percentage of TFEB positive nuclei versus total nuclei after Torin challenge (n = 3, mean ± SEM; **P < 0.001 versus control cells by Student's t‐test).
-
B, CCharacterization of TFEB shRNA (n = 3). (B) Western blot of TFEB in human ECs carrying five different commercial sh‐TFEB RNAs (1‐5) or the appropriate control (scr‐shRNA) transduced by pLKO lentivirus vector. (C) TFEB mRNA expression analyzed by qPCR in ECs carrying the different TFEB shRNAs (1‐5). Data are expressed as relative fold‐change compared with scr‐shRNA after normalization to the housekeeping gene TBP (n = 3, mean ± SEM; ***P < 0.0001 by Student's t‐test).
-
DTFEB silencing reduced murine EC proliferation. Representative graph of lung ECs isolated from control and Tfeb iEC−/− mice ECs treated for 24 h with FCS (20%) or VEGF‐A (30 ng/ml). DNA incorporation of EdU was detected by flow cytometry. The percentage of proliferating cells is indicated (n = 4, mean ± SEM; ***P < 0.0001 versus ECs derived from control mice by Student's t‐test).
-
ETFEB silencing does not affect human EC migration. Bar graph indicates the percentage of migrated sh‐TFEB and scr‐shRNA ECs stimulated with VEGF‐A (30 ng/ml, 5 h; n = 6, mean ± SEM, P = ns versus scr‐shRNA by Student's t‐test).
Source data are available online for this figure.
