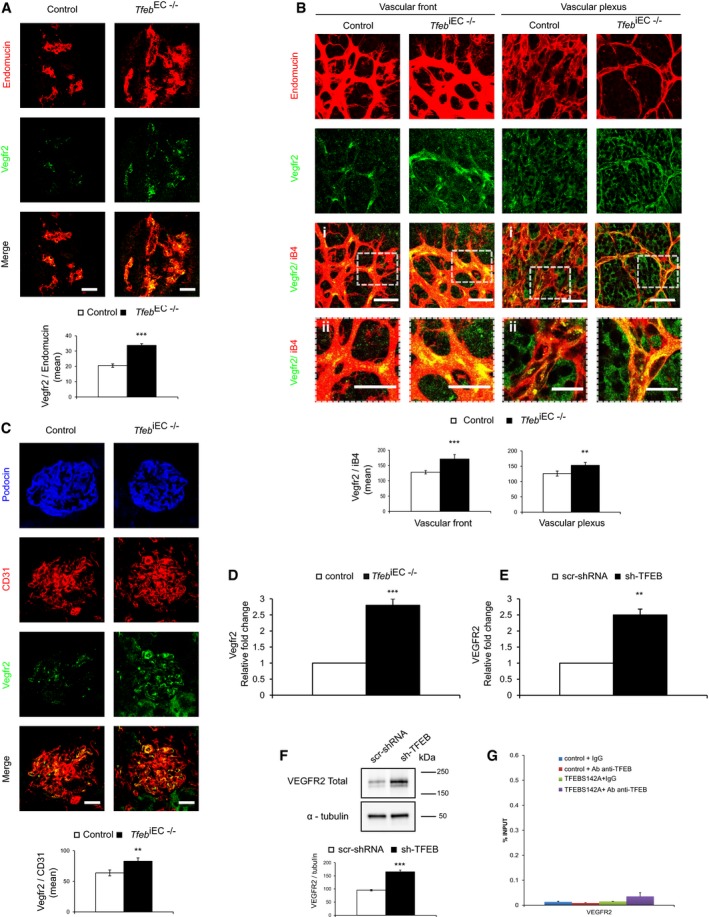
Figure 5. Regulation of VEGFR2 by TFEB in ECs.

-
A–CIncrease in Vegfr2 expression in the vasculature of Tfeb EC−/− and Tfeb iEC−/− mice. (A) Representative immunostaining images of Tfeb EC−/− embryonic vessels (E10.5) stained with anti‐endomucin and anti‐Vegfr2 Abs (scale bars: 50 μm). Bar graph indicates the Vegfr2 mean intensity only in endomucin+ vessel areas (embryos n = 6, mean ± SEM; ***P < 0.0001 versus control embryos by Student's t‐test). (B) Representative immunostaining images (i) and detail (ii) of the vascular front and vascular plexus of the retina (p5) of control and Tfeb iEC−/− mice with anti‐iB4 and anti‐Vegfr2 Abs (scale bars: 50 μm). Bar graph indicates the Vegfr2 mean intensity only in iB4+ vessel areas (mice n = 6, mean ± SEM; **P < 0.001 and ***P < 0.0001 versus control mice by Student's t‐test). (C) Representative immunostaining images of the glomerulus (p17) of control and Tfeb iEC−/− mice with anti‐podocin, anti‐CD31, and anti‐Vegfr2 Abs (scale bars: 50 μm). Bar graphs indicate the Vegfr2 mean intensity in CD31+ vessel areas (mice n = 6, mean ± SEM; **P < 0.001 versus control mice by Student's t‐test).
-
D–FVEGFR2 expression is regulated by TFEB. (D, E) qPCR of VEGFR2 in lung ECs obtained from control and Tfeb iEC−/− mice (D) and in human sh‐TFEB (E). Data are expressed as relative fold‐change compared with the expression in control cells after normalization to the housekeeping gene TBP (n = 3, mean ± SEM; **P < 0.001 and ***P < 0.0001, by Student's t‐test). (F) Immunoblots of total lysates from scr‐shRNA and sh‐TFEB ECs probed with anti‐VEGFR2 and α‐tubulin Abs. The bar graph shows the densitometric analysis expressed as the ratio between VEGFR2 and α‐tubulin (n = 3, mean ± SEM; ***P < 0.0001 versus scr‐shRNA by Student's t‐test).
-
GAnalysis of TFEB binding to the VEGFR2 promoter in human ECs. ChIP was performed using digested chromatin from human control ECs and TFEBS142A ECs incubated with IgG (indicated in the bar graph as “+IgG”) or with Ab anti‐TFEB (indicated in the bar graph as “+Ab anti‐TFEB”), followed by qPCR for VEGFR2. Bar graph shows the percent enrichment (n = 3, mean ± SD).
Source data are available online for this figure.
