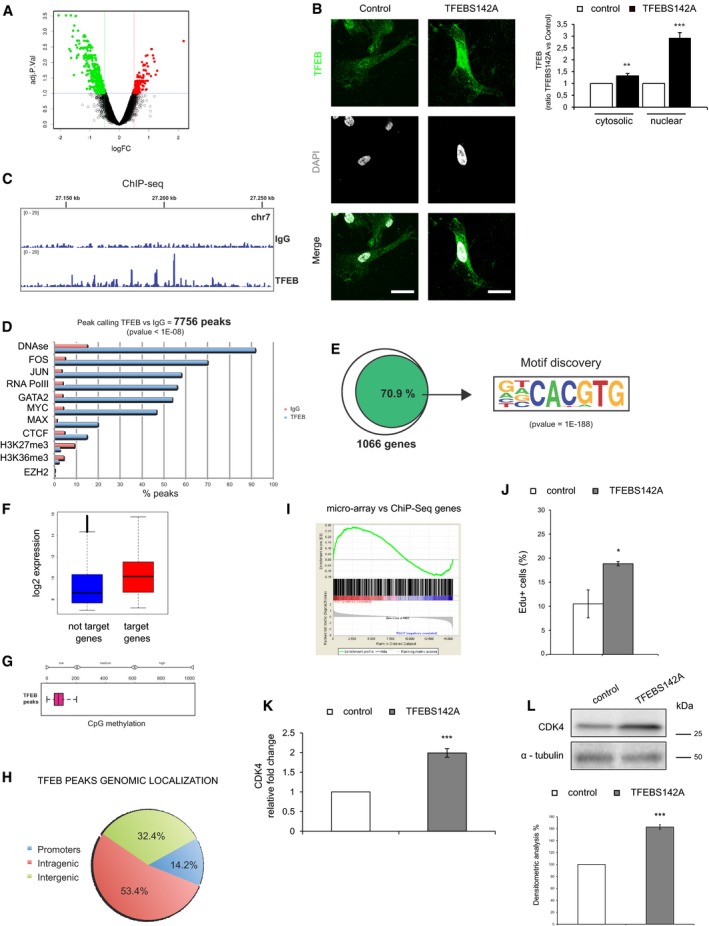
Figure EV5. TFEB gene regulation in human ECs.

-
AVolcano plots of human gene expression showing fold‐change and P‐value data comparing human sh‐TFEB and scr‐shRNA ECs. Red: up‐regulated genes; green: down‐regulated genes.
-
BCharacterization of TFEBS142A overexpression in human ECs. Representative images of human ECs transduced with pTRIPZ‐TFEBS142A inducible lentivirus (scale bars: 20 μm) after transgene induction with doxycycline (0.5 μg/ml, 3 h; TFEBS142A) or not (control) and stained with anti‐TFEB Ab and DAPI. Bar graph indicates the quantity of cytosolic and nuclear TFEB as ratio between TFEBS142A and control ECs (n = 10, mean ± SEM, **P < 0.0001 and ***P < 0.0001 by Student's t‐test).
-
CRepresentative genomic view of the TFEB ChIP‐seq analysis. The TFEB ChIP‐seq plot shows distinct binding peaks with respect to the IgG ChIP‐seq.
-
DComparison of the TFEB‐bound genomic regions with respect to the other indicated ChIP‐seq regions taken from the literature. TFEB correlates with open chromatin (DNAse) and with transcription factors known to be associated with active gene promoters (FOS, JUN, RNA PolII, MYC).
-
EEnrichment of the E‐box DNA‐binding sequence of TFEB (CACGTG) on 70.9% of TFEB target genes in human ECs.
-
FComparison of expression values in human ECs between TFEB‐bound and unbound genes. Box plots are median‐centered. The end of the box shows the upper and lower quartiles. The whiskers line shows the highest and lowest value excluding outliers.
-
GDNA methylation analysis of the TFEB‐bound regions in human ECs using 450K Illumina microarray data from the literature (methylation status of 6,461 CpG has been analyzed).
-
HGenomic localization of TFEB‐bound regions in human ECs.
-
IGSEA analysis of TFEB‐bound genes comparing human sh‐TFEB and scr‐shRNA ECs microarray data. Enrichment plot shows modulated TFEB‐bound genes.
-
JTFEB overexpression increased EC proliferation. Representative graph of control and TFEBS142A ECs treated for 24 h with FCS (20%). DNA incorporation of EdU was detected by flow cytometry. The percentage of proliferating cells is indicated (n = 4, mean ± SEM; *P < 0.01 versus control ECs by Student's t‐test).
-
K, L(K) qPCR and (L) immunoblots showing modulation of CDK4 after TFEB overexpression in ECs. (K) Data are expressed as relative fold‐change compared with the expression in control cells after normalization to the housekeeping gene TBP (n = 3, mean ± SEM; ***P < 0.0001 by Student's t‐test). (L) Immunoblots of total lysates from control and TFEBS142A ECs probed with specific Abs. The bar graph shows the densitometric analysis expressed as % of CDK4 in TFEBS142A versus control ECs after the normalization with α‐tubulin (n = 3, mean ± SEM; ***P < 0.0001 versus scr‐shRNA by Student's t‐test).
Source data are available online for this figure.
