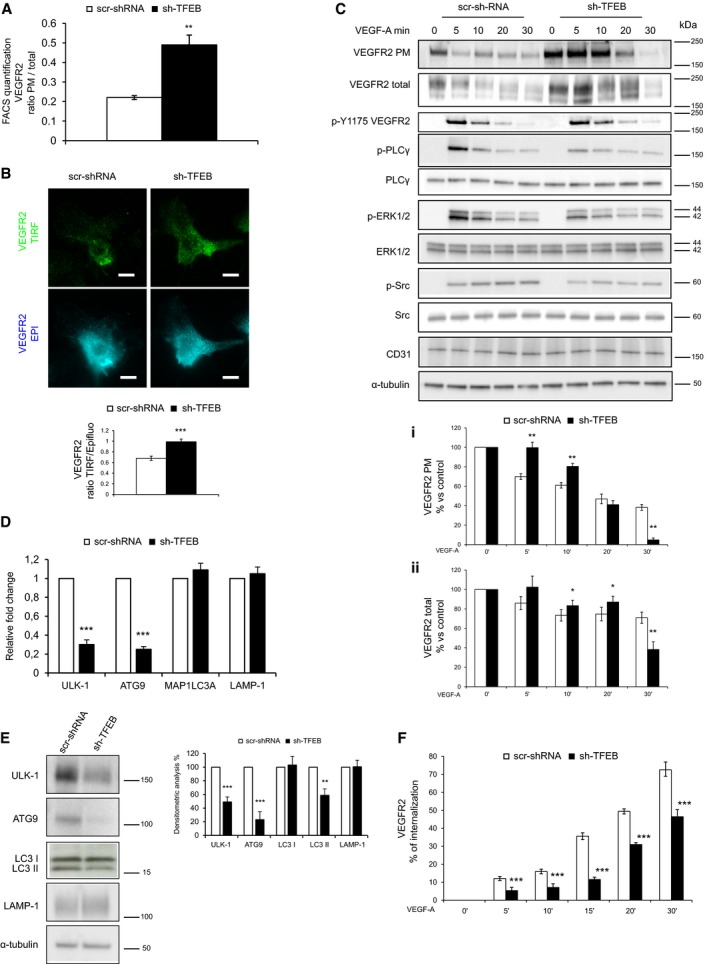
Figure 6. Role of TFEB in regulating VEGFR2 localization and activity in human ECs.

-
A, BSilenced TFEB alters the localization of VEGFR2. (A) FACS analysis of surface VEGFR2 expression on human scr‐shRNA and sh‐TFEB ECs. Bar graph shows the ratio between total and PM VEGFR2 (n = 6, mean ± SEM; **P < 0.001 versus scr‐shRNA by Student's t‐test). (B) Representative TIRF and epifluorescence images of human scr‐shRNA and sh‐TFEB ECs after staining with anti‐VEGFR2 Ab (scale bars: 10 μm). Bar graphs show the ratio of VEGFR2 analyzed in epifluorescence and TIRF mode analyzed by TIRF (n = 40, mean ± SEM; ***P < 0.0001 versus scr‐shRNA by Student's t‐test).
-
CSilenced TFEB alters the localization and the phosphorylation state of VEGFR2 and its signal transduction. Representative immunoblot of PM biotinylated portion and total cell lysates of scr‐shRNA and sh‐TFEB ECs after VEGF‐A stimulation (30 ng/ml). Blots of total or PM cell lysates were probed with anti‐VEGFR2. Blots of total cell lysates were probed with anti‐p‐Y1175‐VEGFR2, anti‐PLCγ, p‐PLCγ, anti‐ERK‐1/2, anti‐pERK1/2, anti‐p‐Src, anti‐Src, anti‐CD31, and α‐tubulin Abs. The bar graphs (i,ii) show densitometric analysis of stimulated versus unstimulated scr‐shRNA and sh‐TFEB ECs expressed as: (i) % of VEGFR2 on PM fraction (n = 3, mean ± SEM; ANOVA P < 0.02; **P < 0.001 versus scr‐shRNA by Bonferroni post‐test), (ii) % of VEGFR2 total (n = 3, mean ± SEM; ANOVA P > 0.05; *P < 0.05 and **P < 0.001 versus scr‐shRNA by Bonferroni post‐test).
-
D, ERegulation of autophagy and lysosome pathway by TFEB silencing. (D) qPCR and (E) immunoblots showing the differentially expressed autophagy‐ and lysosome‐related genes between human scr‐shRNA and sh‐TFEB ECs. (D) Data are expressed as relative fold‐change compared with the expression in control cells after normalization to the housekeeping gene TBP (n = 3, mean ± SEM; ***P < 0.0001 by Student's t‐test). (E) Immunoblots of total lysates from human scr‐shRNA and sh‐TFEB ECs probed with anti‐ULK‐1, anti‐ATG9, anti‐LC3‐I/II, anti‐LAMP‐1, and α‐tubulin Abs. The bar graph shows the densitometric analysis expressed as the ratio between scr‐shRNA and sh‐TFEB ECs (n = 3, mean ± SEM; **P < 0.001, ***P < 0.0001 versus scr‐shRNA by Student's t‐test).
-
FTFEB silencing inhibits VEGFR2 internalization. Bar graphs of VEGFR2 internalization expressed as the percent of internalized VEGFR2 versus PM VEGFR2 after VEGF‐A stimulation (n = 6, mean ± SEM, ANOVA P < 0.0001; ***P < 0.0001 versus scr‐shRNA by Bonferroni post‐test).
Source data are available online for this figure.
