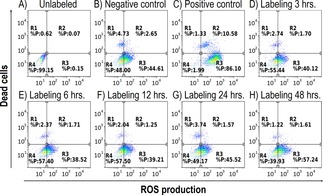
Figure 4.

FACS analysis of ROS production in unlabeled cells (A), negative control (B), positive control (C), cells labeled at 0.11 mM(Mn0.61Zn0.42Fe1.97O4) concentration 3 hours (D), 6 hours (E), 12 hours (F), 24 hours (G) and 48 hours (H). Dot plots show multiparametric analysis of ROS production and cell death. Horizontal axis: CELLRox DeepRed Reagent, vertical axis: SYTOXBlue. Quadrant gate: region R1: dead cells negative for ROS, R2: dead cells positive for ROS, R3: ROS production in living cells, R4: live intact cells without ROS production. No significant difference between negative cells and NPs‐treated cells was found. As depicted on negative control, BM‐MSCs have basal ROS production.
