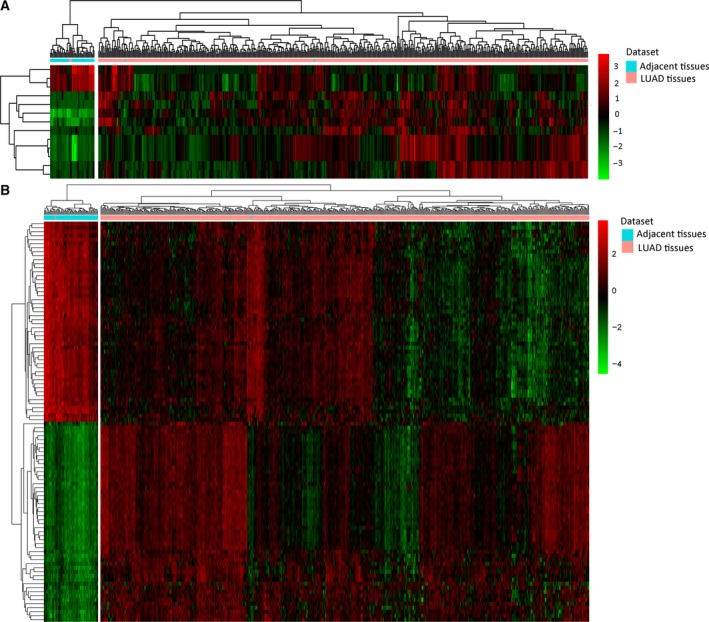
Figure 1.

Hierarchical clustering analysis of DEmiRNAs and the top 100 DEmRNAs between LUAD and adjacent tissues. (A) DEmiRNAs; (B) the top 100 DEmRNAs. Rows and columns represent DEmiRNAs/DEmRNAs and tissue samples. The color scale represents the expression levels.
