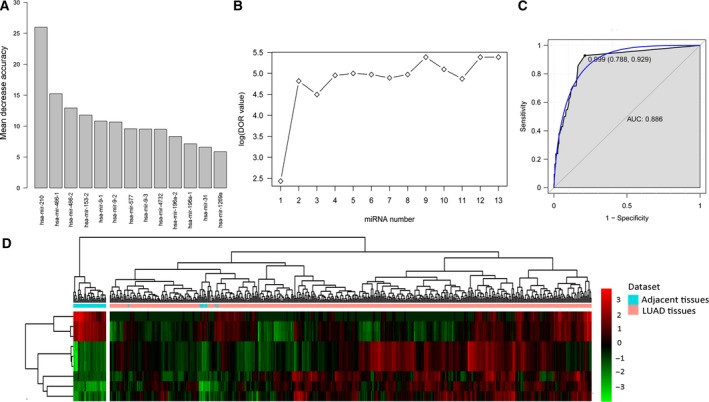
Figure 2.

Identification of miRNA biomarkers for LUAD. (A) The variance rate of prediction accuracy for each DEmiRNA. (B) The variance rate of classification performance when increasing the number of the predictive miRNAs. (C) ROC results of combinations of nine miRNA biomarkers based on random forest classification model. (D) Hierarchical clustering analysis of the nine miRNA biomarkers between LUAD and adjacent tissues. Rows and columns represent DEmiRNAs and tissue samples. The color scale represents the expression levels.
