Figure 3.

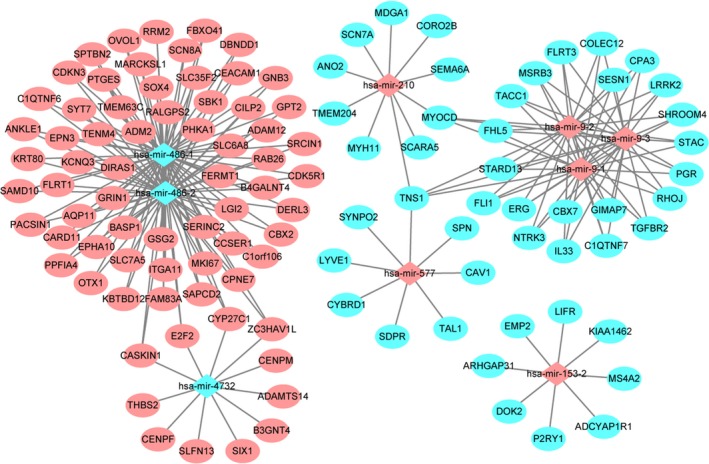
LUAD‐specific DEmiRNA–DEmRNA interaction network. The ellipses and rhombuses represent the DEmRNAs and DEmiRNAs, respectively. Red and blue represent up‐ and down‐regulation, respectively.

LUAD‐specific DEmiRNA–DEmRNA interaction network. The ellipses and rhombuses represent the DEmRNAs and DEmiRNAs, respectively. Red and blue represent up‐ and down‐regulation, respectively.