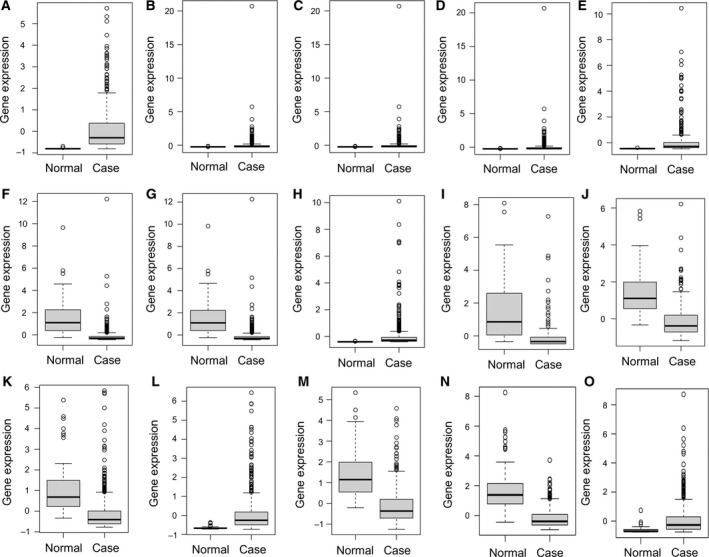
Figure 4.

The expression levels of DEmiRNAs and DEmRNAs between LUAD and adjacent tissues. The x‐axes represent normal (LUAD) and control (adjacent tissues) groups. The y‐axes represent gene expression levels. (A) hsa‐mir‐210, (B) hsa‐miR‐9‐1, (C) hsa‐miR‐9‐2, (D) hsa‐miR‐9‐3, (E) hsa‐mir‐153‐2, (F) hsa‐mir‐486‐1, (G) hsa‐mir‐486‐2, (H) hsa‐mir‐577, (I) hsa‐mir‐4732, (J) FLI1, (K) NTRK3, (L) SLC7A5, (M) TGFBR2, (N) ERG and (O) SIX1.
