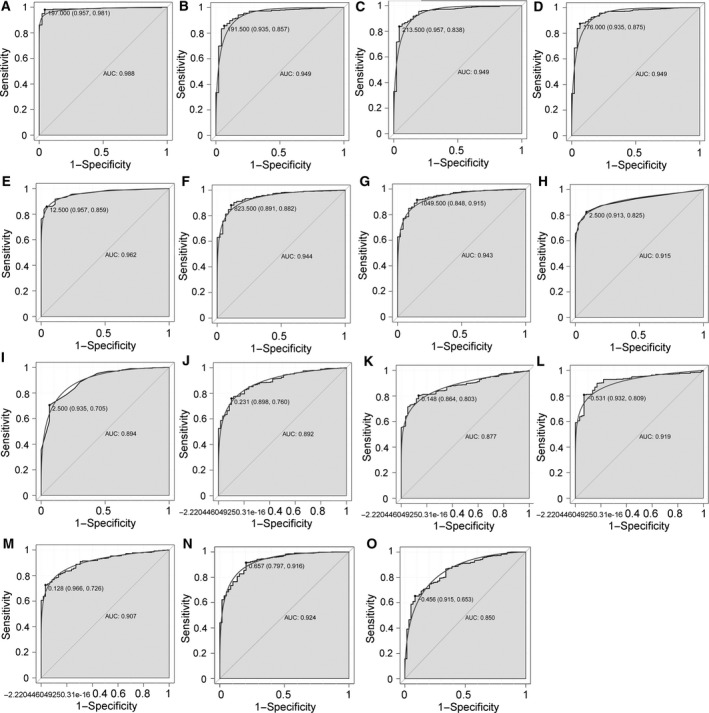
Figure 5.

The ROC curves of selected DEmiRNAs and DEmRNAs between LUAD and adjacent tissues. The x‐axes show 1 − specificity (the proportion of false positives) and y‐axes show sensitivity (the proportion of true positives). (A) hsa‐mir‐210, (B) hsa‐miR‐9‐1, (C) hsa‐miR‐9‐2, (D) hsa‐miR‐9‐3, (E) hsa‐mir‐153‐2, (F) hsa‐mir‐486‐1, (G) hsa‐mir‐486‐2, (H) hsa‐mir‐577, (I) hsa‐mir‐4732, (J) FLI1, (K) NTRK3, (L) SLC7A5, (M) TGFBR2, (N) ERG and (O) SIX1.
