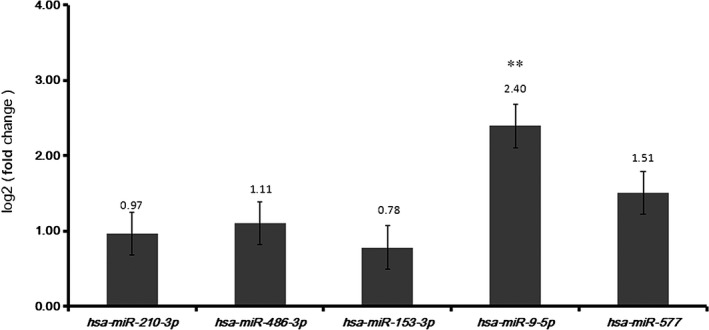
Figure 6.

qRT‐PCR results for DEmiRNAs between LUAD and adjacent tissues. Statistical significance was assessed by one‐way ANOVA. The error bars indicate SD. n = 3. The x‐axis and y‐axis represent DEmiRNAs and log fold change, respectively. **P < 0.01.
