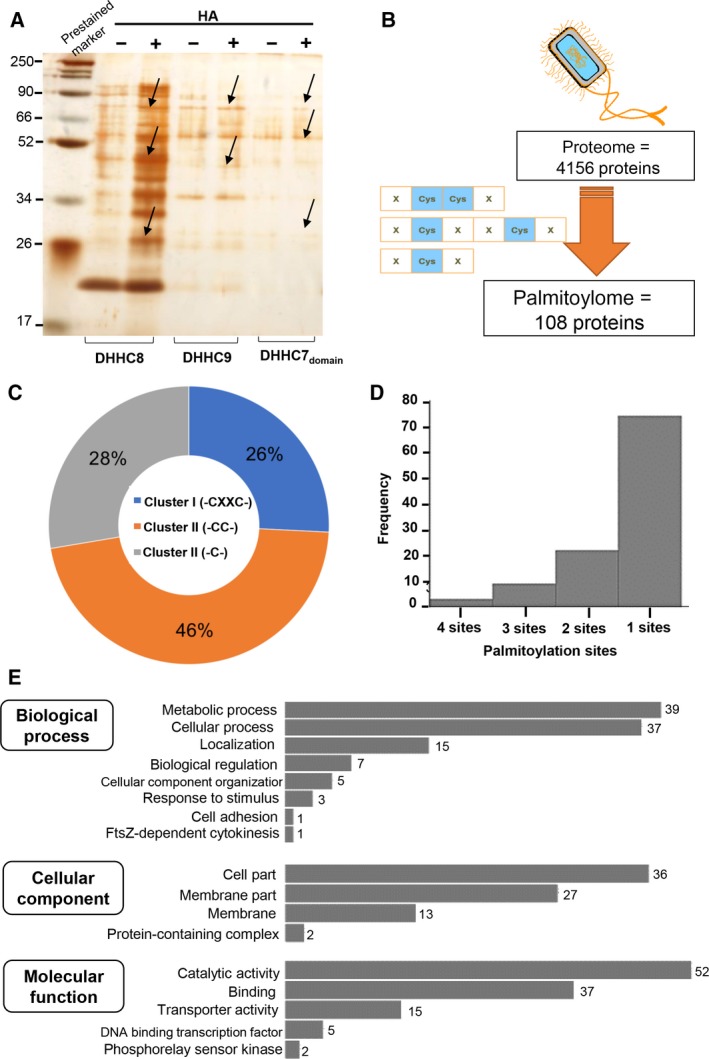
Figure 7.

(A) ABE purification of whole proteome of individual PfDHHCs‐E. coli. (B) Scheme showing the in silico strategy for elucidation of potential palmitoylome in E. coli. (C) Pie chart showing the proportion of different palmitoylation site types in 108 proteins. (D) Histogram plot showing the frequency of palmitoylation per protein within the candidate palmitoylome (108). (E) GO analysis plots showing enriched various important GO biological process, cellular component, and molecular function terms among 108 proteins.
