
Figure 5.
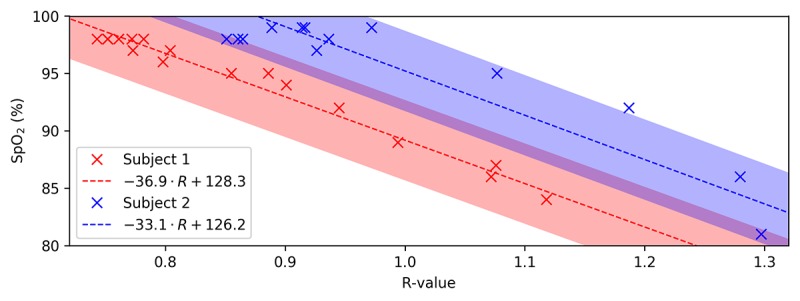
When characterizing the R-value for SpO2 (peripheral oxygen saturation) estimation on the seat with controlled desaturation testing, the R-curve slope matches literature and is the same across subjects. A different offset necessitates the use of a per-subject calibration for absolute SpO2 estimation. The shaded regions represent the acceptable level of error around the best fit line according to the ISO standard for pulse oximetry.