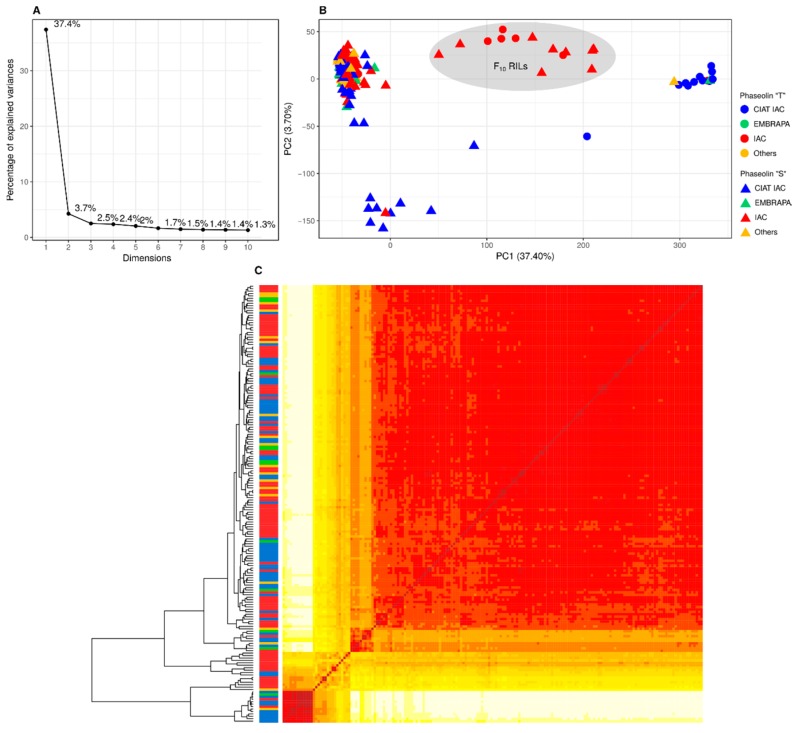
Figure 2.
Population structure inferred by principal component analysis (PCA) (A and B) and the dendrogram and the heatmap (C) of a kinship matrix estimated by the simple matching coefficient, extended to account for loci that are identical by state but not identical by descent, based on 10,362 single nucleotide polymorphism (SNP) markers (minor allele frequency > 5%), among 180 genotypes from the IAC diversity panel. The colored shapes (B) were classified in two groups in accordance with the type of phaseolin: “T” (circle) and “S” (triangle), which have Andean and Mesoamerican origin, respectively. The colors shown in B and the scale between the dendrogram and the heatmap (C) corresponds to the breeding institution.

