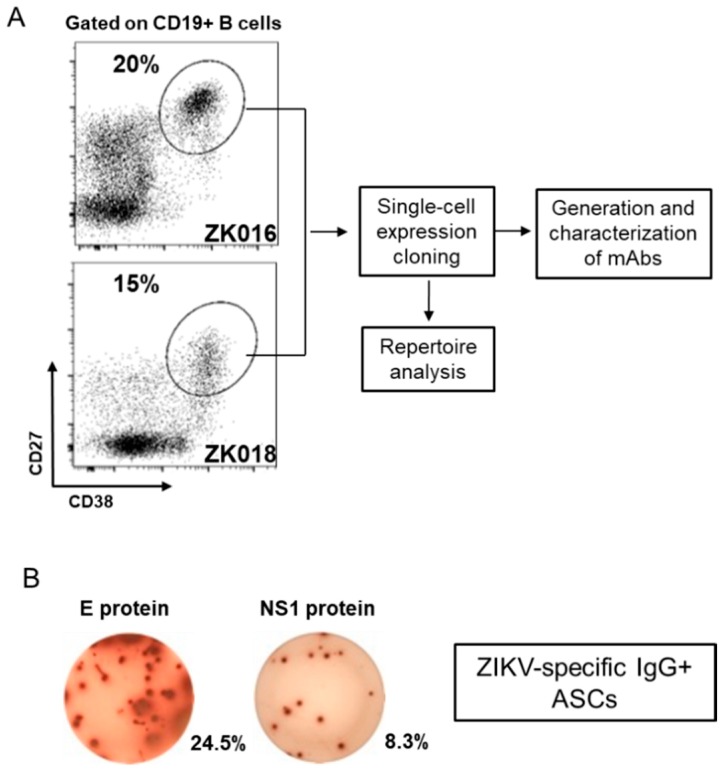
Figure 2.
Virus-specific plasmablasts appear in circulation early after ZIKV infection. (A) Flow cytometry plots showing patient plasmablast (CD3− CD19+ CD20−/low CD38high CD27high) frequencies as a fraction of total CD19+ B cells. PBMCs were isolated from whole blood collected from patient ZK016 (7 DPO) and patient ZK018 (8 DPO) for flow cytometry analysis and plasmablast sorting. The workflow chart follows the generation and characterization of mAbs from single-cell sorted plasmablasts. (B) Representative ELISpot showing ZIKV E protein and NS1 protein-specific antibody secreting cells (ASCs). The wells shown contain 7 DPO PBMCs from patient ZK016. The percentages beside the wells represent the frequency of antigen-specific ASCs relative to the total number of IgG + ASCs.

