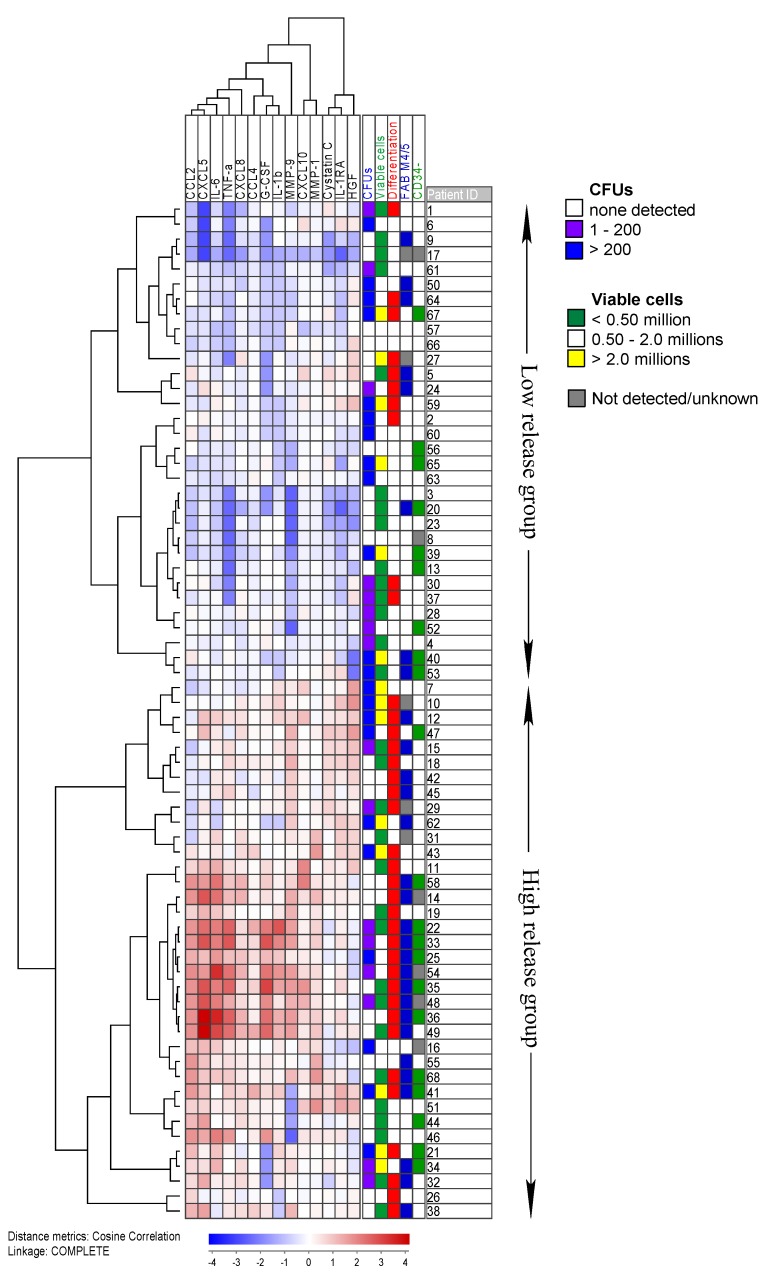
Figure 4.
A cluster of the 14 cytokines that were differentially expressed for cells that showed morphological changes during suspension culture. The cluster shows the week 1 concentrations for all 68 patients. All values were median normalized and log transformed, thus the blue color indicates values below the median. Information about the number of detected colonies, the viable cell population, the presence of morphological changes over time and the blast morphology, according to the French-American-British (FAB) system and CD34 expression, is provided on the right. Both blasts with a change in their phenotype during culture and with signs of monocytic differentiation (FAB M4/5) are overrepresented in the high release group. On the other hand, colony number correlates with cell number but not with cytokine expression.

