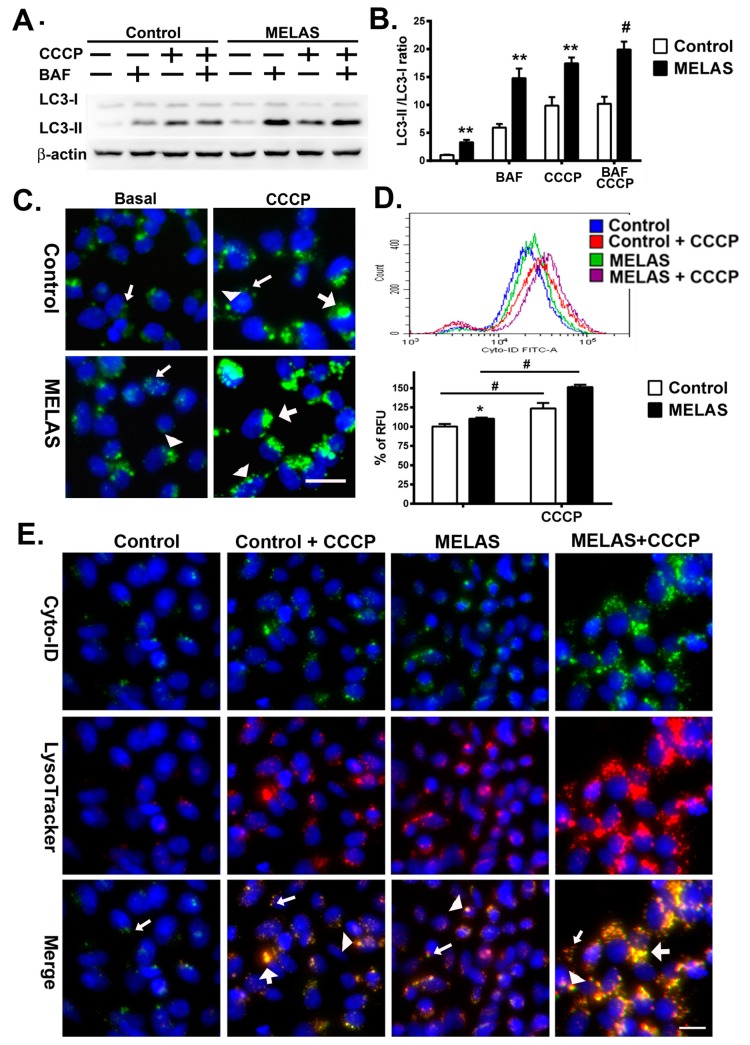
Figure 2.
Increase of autophagic flux in MELAS iPS cells. (A) Western blots of LC3 expression of iPS cells in the presence or absence of bafilomycin (BAF) and Carbonyl cyanide m-chlorophenylhydrazone (CCCP), respectively, for the study of autophagic flux. (B) Quantification of LC3 levels normalized for β-actin. (C) Microscopy fluorescence images showing autophagosomes stained by Cyto-ID green dye. Small arrow indicates small puncta. Arrow head indicates large puncta. Large arrow indicates enlarged puncta. (D) Representative flow cytometry histogram and quantification of Cyto-ID green fluorescence levels normalized for number of cells. (E) Microscopy fluorescence images showing autolysosomes by colocalization of Cyto-ID green dye and LysoTracker Red. Small arrow indicates small puncta. Arrow head indicates large puncta. Large arrow indicates enlarged puncta co-localized with Cyto-ID green and LysoTracker Red. All measurements are expressed as mean values ± SEM, n = 3–5. * p < 0.05, ** p < 0.01, # p < 0.001, versus control. RFU: relative fluorescence unit. Scale bar: 20 μm.

