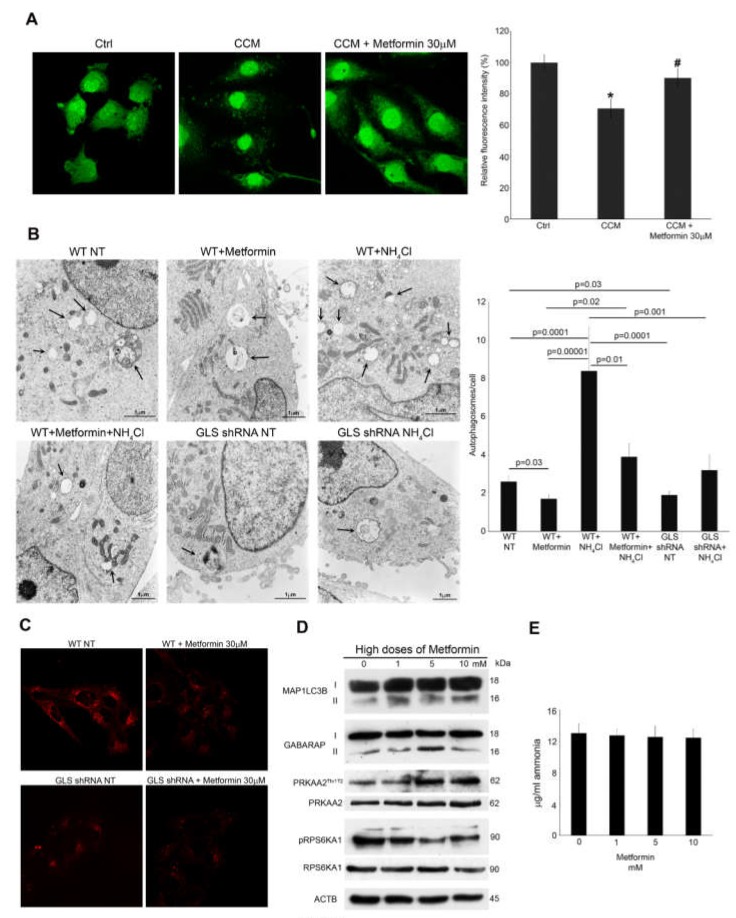
Figure 5.
Metformin or GLS silencing reduces autophagosomes formation; (A) MDA-MB-231 cells (CCM) were plated in conditioned medium from CAM cells as described in Figure 4D for 48 h to stimulate autophagy in the presence or absence of metformin. At the same time MDA-MB-231 control cells (Ctrl) were plated in fresh medium for 48 h. At the end of the treatments, both Ctrl and CCM cells were labelled with AHA as described under Material and Methods. Cells were then fixed, permeabilized and stained for 2 h with alkine-Alexa Fluor 488. Fluorescence from long-lived proteins was observed using aLSM 510 confocal microscopy (Zeiss). MDA-MB-231 cells were placed in a 96 well plate, treated and labelled as described above. Right side: Fluorescence from long-lived protein was measured using a GloMax®-Multi Detection System (Promega). # Significantly different from CCM treated cells.; (B) MDA-MB-231 cells were either left untreated or treated with metformin 30 μM, NH4Cl 10 mM or a combination of the two. Alternatively, MDA-MB-231 GLS shRNA cells were left untreated or treated with NH4Cl 10 mM. The cells were then processed for electron microscopy as described under Materials and Methods. Upper left: WT cells showing autophagosomes, (Magnification 15,500×). Upper middle: WT + metformin cells showing a lower number of autophagosomes (magnification 11,500×). Upper right: WT + NH4Cl cells showing an increase in autophagosomes (magnification 11,500×). Lower left: WT + metformin + NH4Cl cells showing a reduction in autophagosomes (magnification 11,500×). Lower middle: GLS shRNA cells showing a low number of autophagosomes (magnification 15,000×). Lower right: GLS shRNA + NH4Cl cells showing a large autophagosome (magnification 11,500×). Black arrows point to autophagosomes and autophagolysosomes. Results were quantified on the graph reported on the right side showing reduction of autophagosomes following metformin treatment or GLS silencing. Number of autophagosomes were obtained by counting three different fields for each image from two separate experiments; (C) MDA-MB-231 WT and GLS shRNA cells were either left untreated or treated with metformin 30 μM for 20 days. At the end of the treatment, 50 nM Lysotracker red was added to the cells for 30 min followed by a wash in PBS before confocal analysis of lysosome staining as described under materials and methods. Upper left: WT untreated cells showing lysosomes accumulation. Upper right: reduced lysosomes in Metformin treated cells. Lower left: GLS shRNA cells showing reduced lysosome staining. Lower right: Metformin treatment did not reduce lysosomes accumulation in GLS shRNA cells; (D) MDA-MB-231 cells were treated with high doses of metformin from 1 to 10 mM for 48 h. At the end of the treatment, cells were processed to obtain whole cell lysates. MAP1LC3B, GABARAP, pPRKAA2Thr172, PRKAA2, pRPS6KA1 and RPS6KA1 expression was determined by Western blot. ACTB was used as loading control. Densitometric analysis of the gels was performed as described under Materials and Methods; (E) MDA-MB-231 cells were treated with high doses of metformin from 1 to 10 mM for 48 h. Ammonia level in the culture medium was measured as indicated in the Material and Methods section. All experiments in this figure were repeated three times. * Significantly different from control untreated cells.

