Figure 5.
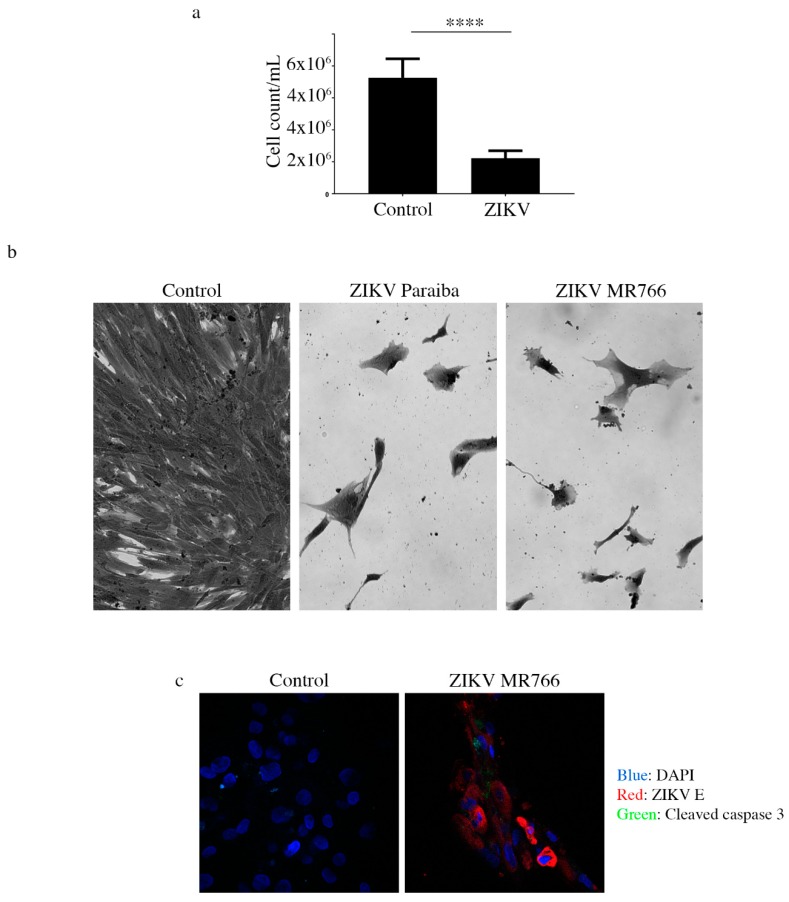
Analysis of continued cell death in ZIKV-infected testicular cells. (a) Cell count graph showing that there were 2-times more cells in the uninfected Hs1.Tes control, compared to ZIKV Paraiba-infected Hs1.Tes cells at P1. For both control and ZIKV-infected cells, the count was done after 7 days of cell passage. ****, p < 0.0001 (unpaired t-test). (b) Microscopic images showing loss of the Hs1.Tes monolayer in ZIKV-infected cells at P3. The morphology of infected cells at this time point appeared grossly aberrant and pleomorphic when compared to that of uninfected control cells. Cells were imaged at a magnification of 400×. (c) Confocal microscopy images showing cleaved caspase 3 in some ZIKV-infected Sertoli cells at P1. Not all ZIKV E protein-expressing cells stained positive for cleaved caspase 3, supporting the notion that cell death in persistently infected cells was progressive. Cells were imaged at a magnification of 400×.

