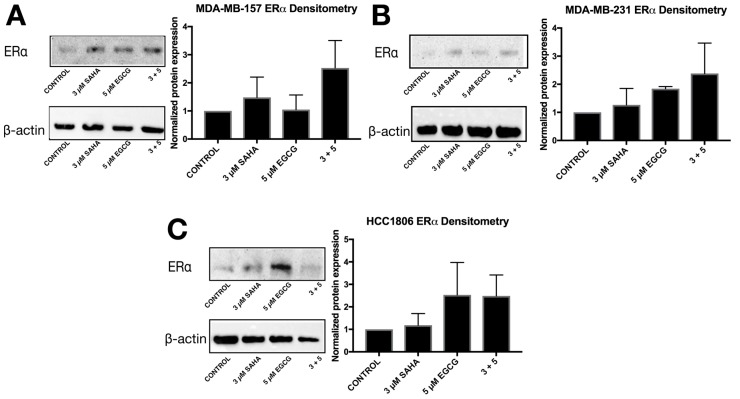
Figure 8.
SAHA + EGCG upregulated estrogen receptor alpha (ERα) in all three TNBC cell lines. (A) After 72 h of treatment with SAHA and/or EGCG, protein was extracted from MDA-MB-157 cells. Cells were probed with ERα primary antibodies (Santa Cruz, Dallas, TX, USA) before imaging. β-actin was used as the control. (B,C) The same was done in MDA-MB-231 and HCC1806 cell lines. Pictures are representative while densitometry analysis is an average of all replicates (n = 3). The same blots were probed multiple times, explaining the duplication of β-actin between figures.

