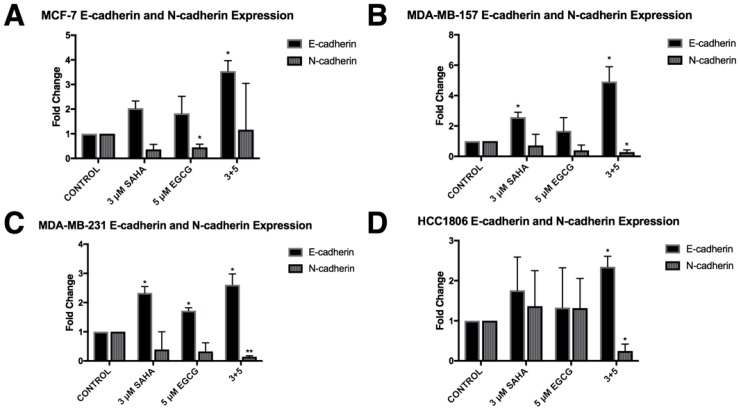
Figure 13.
The expression of E-cadherin was induced with SAHA and EGCG while the expression of N-cadherin was reduced. (A) MCF-7 cells were treated for 72 h with the indicated compounds. qRT-PCR was completed using E-cadherin or N-cadherin primers. N-cadherin was significantly reduced by EGCG alone. (B–D) The same was completed in MDA-MB-157, MDA-MB-231, and HCC1806 cell lines (n = 3). Error bars represent standard error of the mean (SEM); * p < 0.05, ** p < 0.01.

