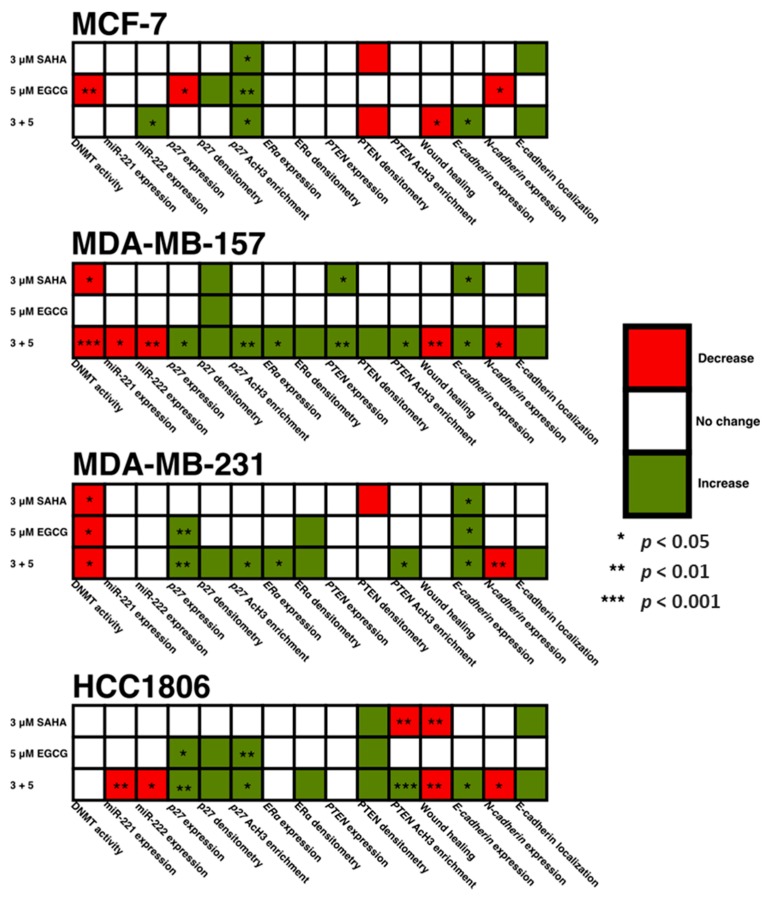
Figure 15.
A summative figure visualizing the findings from the present study. Despite all four cell lines demonstrating a decrease in cell density and growth in Figure 1, there is variance in the mechanisms behind the decrease. The heterogeneity of TNBC is easily visualized in this figure, which can represent the importance of epigenetic-based treatment of TNBC.

