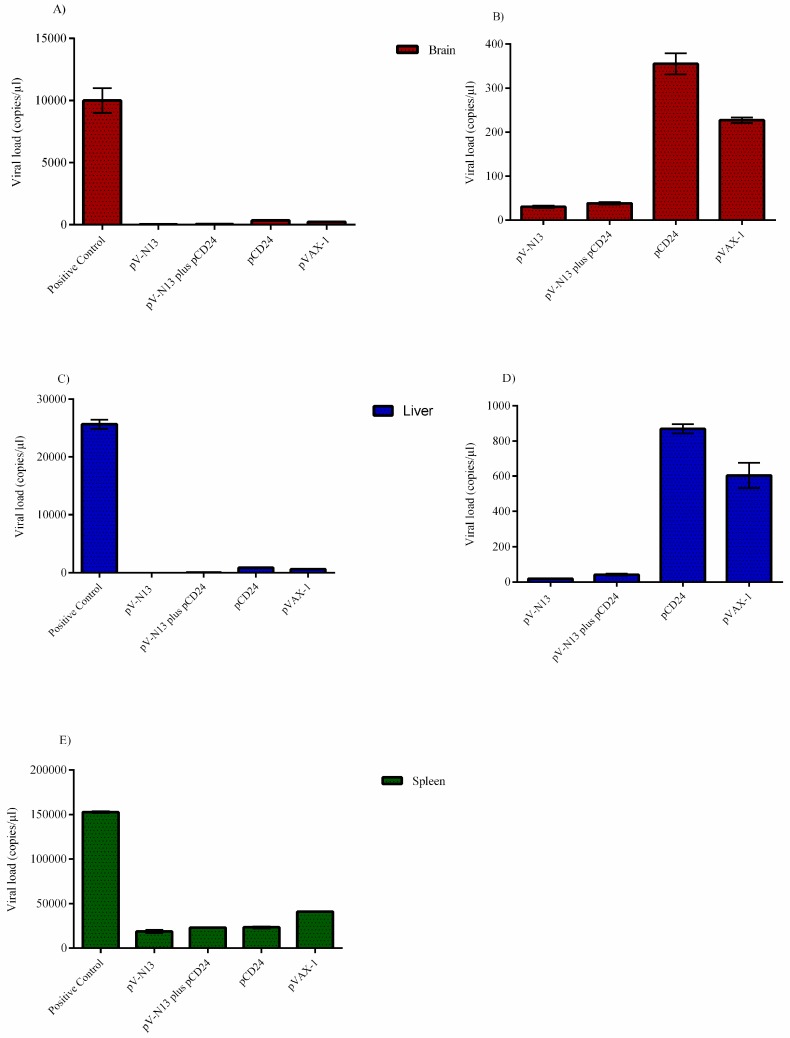
Figure 8.
Viral loads (copy/µL of 100 ng RNA) in the tissues of the challenged IFNAR−/− mice infected with 1000 TCID50 of the Ank-2 strain. The virus copy numbers in the brain (A: all groups; B: all groups except the positive control), liver (C: all groups; D: all groups except the positive control), and spleen (E: all groups) are provided. The most significant virus clearance was observed in the pV-N13 and pV-N13 plus pCD24 groups. All of data are shown as mean ± SD.

