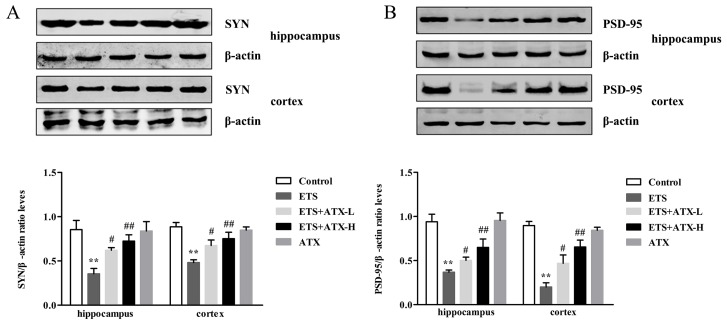
Figure 7.
Effects of ATX on the expression of synaptic proteins in the mouse brain (n = 12). (A) The levels of SYN in the hippocampus and cortex of mice. Data are reported as mean ± SE. (** p < 0.01 versus Group Control; # p < 0.05 versus Group ETS; ## p < 0.01 versus Group ETS). (B) The levels of PSD-95 in the hippocampus and cortex of mice. Data are reported as mean ± SE. (** p < 0.01 versus Group Control; # p < 0.05 versus Group ETS; ## p < 0.01 versus Group ETS).

