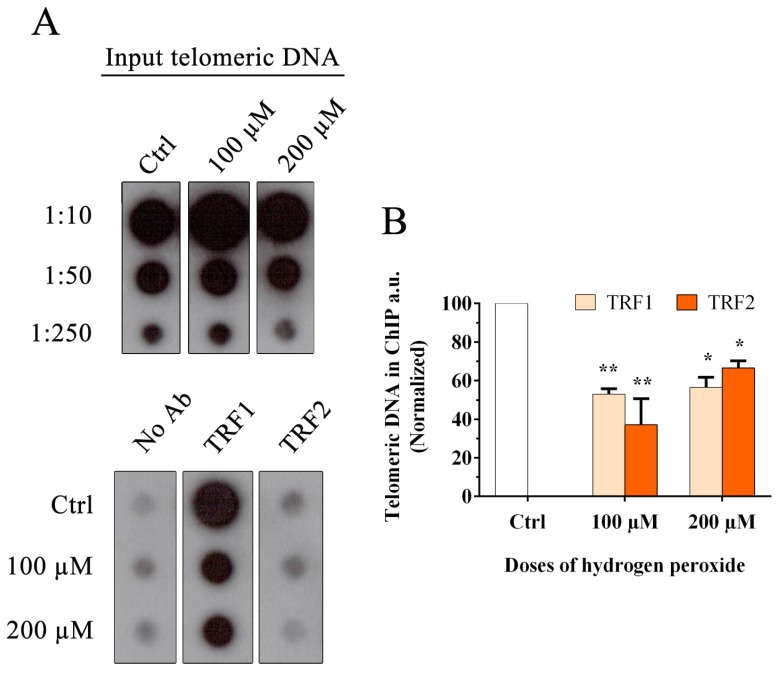
Figure 2.
Chromatin immunoprecipitation and telomere dot-blot for TRF1 and TRF2. (A) Chromatin immunoprecipitation of MRC-5 cells after H2O2 treatment (100 µM and 200 µM) with the indicated antibodies (TRF1 and TRF2) and the negative control (No Ab). Telomeric input signals are necessary for the quantification. For this analysis, a 1:10 input was used. (B) The histogram represents the data obtained by ChIP analysis at 48 h after treatment with two doses of hydrogen peroxide, 100 and 200 μM. Quantification of the immunoprecipitated telomeric sequences was performed after normalization to telomeric input signals. The data are normalized to the control value and are expressed as a percentage of the total telomeric DNA in arbitrary units (a.u.). The error bars denote the standard errors and were calculated using standard propagation rules. Statistical analysis was performed between treated and control samples. * p < 0.05; ** p < 0.01 by Student’s t-test.

