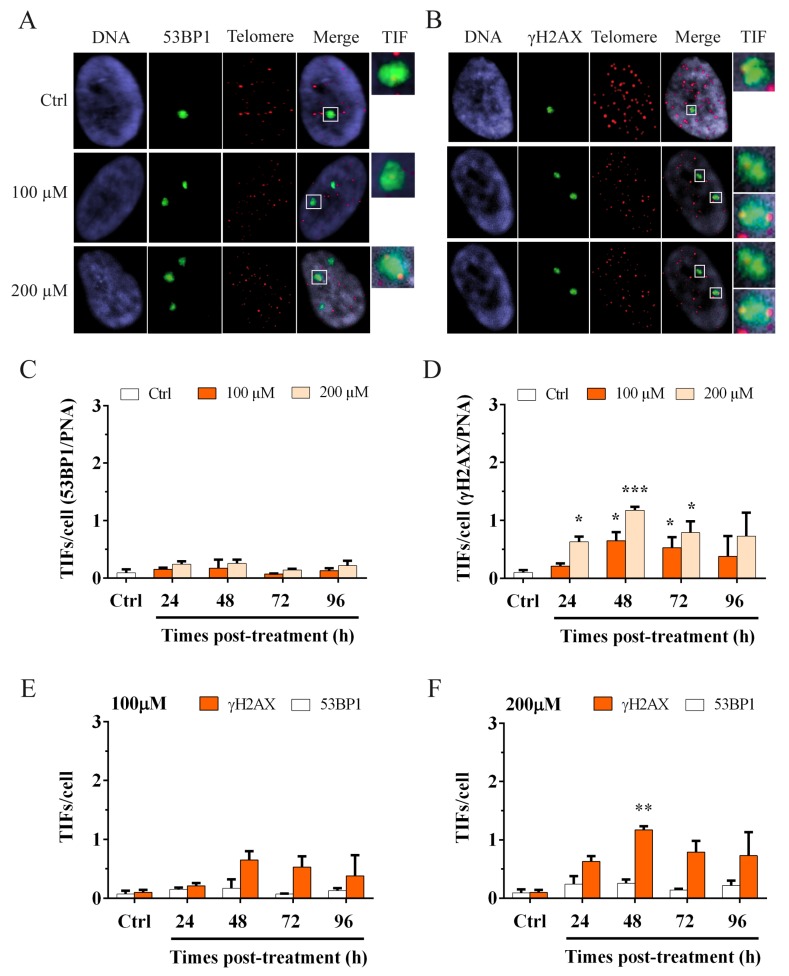
Figure 4.
ImmunoFISH staining to detect telomere dysfunction-induced 53BP1 and γH2AX foci (TIFs). Images of MRC-5 cells stained for (A) 53BP1 foci and the telomeric PNA probe and (B) γH2AX foci and the telomeric PNA probe. The colocalization of both signals (green and red spots) indicates the presence of a telomere dysfunction-induced focus (TIF). More than a one telomeric signal can colocalize with 53BP1 or γH2AX foci (as shown in Figure 4A and Figure 4B-TIF). TIF (last boxes) are enlarged to show the colocalization between 53BP1 and telomeres (A) and between γH2AX and telomeres (B). ImmunoFISH staining was used to detect the activation of the DDR at telomeres. The graphs represent the results of telomeric damage after oxidative stress at different times post-treatment. Two markers of DNA damage were used in the analysis. (C) 53BP1 TIFs. The columns show data obtained by colocalization between 53BP1 foci and telomeres per cell. We observed no differences in treated and untreated samples for both doses of hydrogen peroxide at different times post-treatment. (D) γH2AX TIFs. The columns show data obtained by colocalization between γH2AX foci and the telomeres per cell. We observed a significant increase (p < 0.05) of foci at 48 h after the 100 µM treatment that persisted at 72 h. For 200 µM H2O2, we observed a significant increase at 24 h after treatment, which significantly increased (p < 0.001) at 48 h and still significantly persisted (p < 0.05) at 72 h after treatment. Statistical analysis was performed between treated and control samples. The bars denote the standard error. Statistical analysis was performed between treated and control samples for both 53BP1 and γH2AX TIFs/cell. * p < 0.05; *** p < 0.001 by Student’s t-test. Comparison between 53BP1 and γH2AX TIFs at (E) 100 µM H2O2 and (F) 200 µM H2O2. The graphs show the higher increase of γH2AX TIFs with respect to 53BP1 TIFs, especially at 48 h after 200 µM H2O2 treatment (F), in which this difference was statistically significant (p < 0.01). The bars denote the standard error. Statistical analysis was performed between 53BP1 and γH2AX TIFs/cell. ** p < 0.01 by Student’s t-test.

