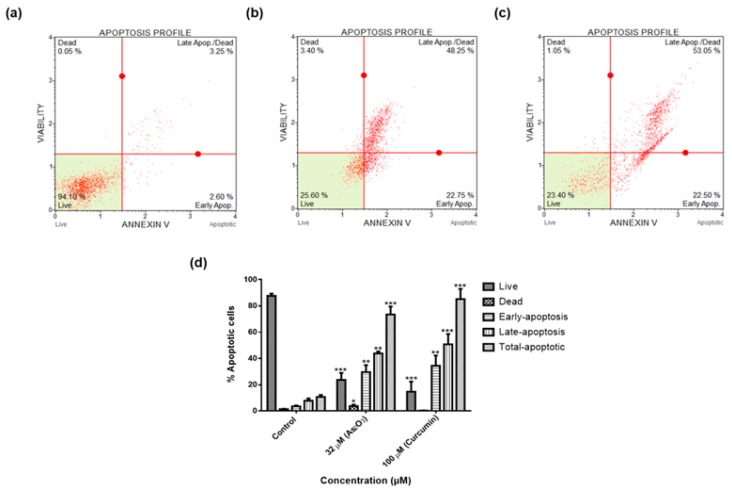
Figure 6.
Apoptosis profiles of MCF-7 cells after 24 h treatment: (a)—Control, (b)—32 µM As2O3, (c)—100 µM curcumin. Shown are representative data of three independent experiments [percentage mean ± SEM] (d). The difference were found to be statistically significant (* p < 0.05, ** p < 0.01 and *** p < 0.001).

