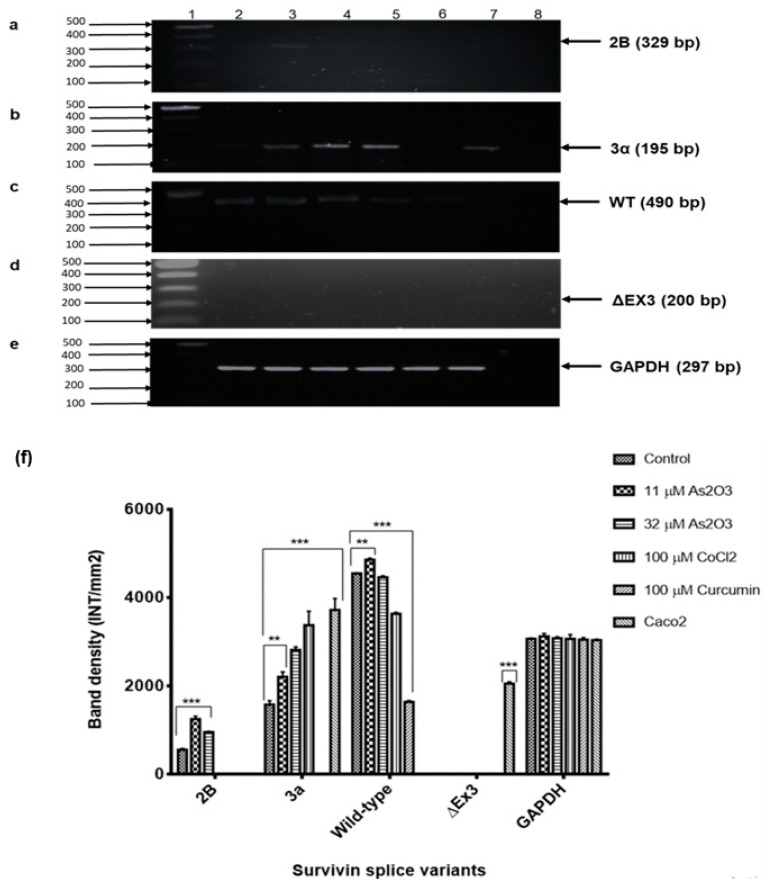
Figure 11.
RT-PCR analyses of survivin splice variants expression, (a)—2B, (b)—3α, (c)—wild-type and (d)—ΔEx3 in MCF-7 breast cancer cells after treating with the As2O3, cobalt chloride and curcumin for 24 h. GAPDH (e) was used as the loading control. The images were captured using Chemidoc XRS image analyser (BioRad, USA). The band density differences of survivin splice variants (f). Shown are representative data of three independent experiments (percentage mean ± SEM). The difference were found to be statistically significant (* p < 0.05, ** p < 0.01 and *** p < 0.001). The density was measured using Quanty-One software (BioRad, USA).

