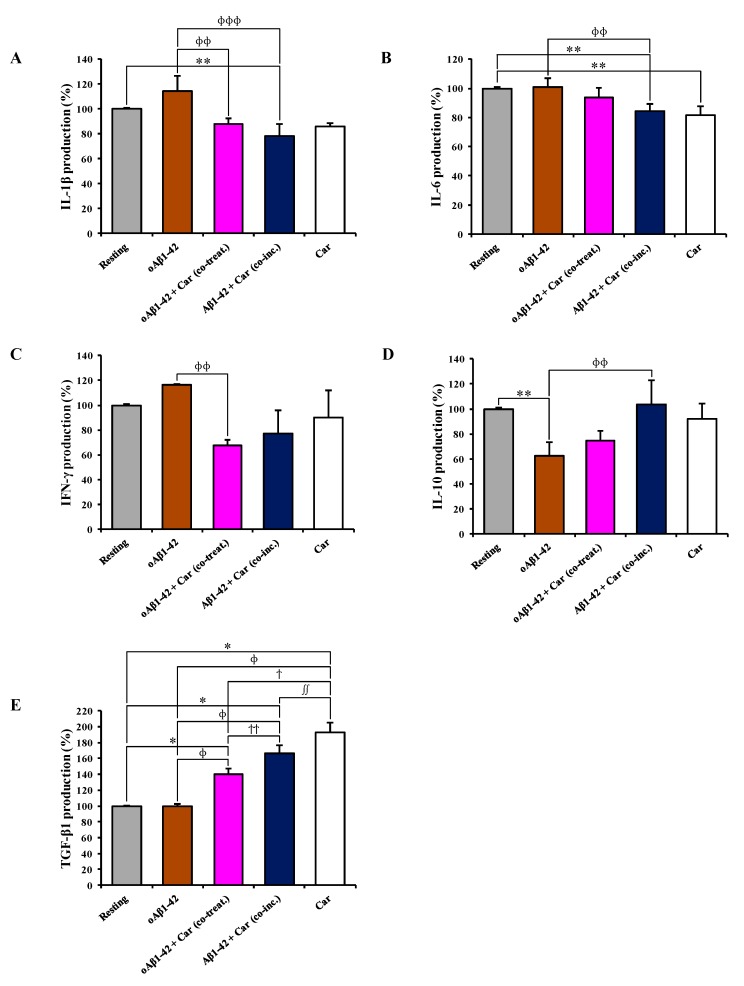
Figure 5.
The modulation of cytokines secretion by carnosine. Supernatants from resting and BV-2 cells stimulated with oAβ1-42 in the absence or presence of carnosine (oAβ1-42 + Car (co-treat.) and Aβ1-42 + Car (co-inc.)) were analyzed using a Custom Multi-Analyte ELISArray Kit. Each treatment was analyzed in triplicate. The production of each cytokine is expressed as the percent variation with respect to the production recorded in resting cells. (A) IL-1β, (B) IL-6, (C) IFN-γ, (D) IL-10, and E) TGF-β1. Standard deviations are represented by vertical bars. * Significantly different from resting cells, p < 0.001, ** significantly different from resting cells, p < 0.05, ɸ significantly different from oAβ1-42-treated cells, p < 0.001, ɸɸ significantly different from oAβ1-42-treated cells, p < 0.05, ɸɸɸ significantly different from oAβ1-42-treated cells, p < 0.01, ϯ significantly different from oAβ1-42 + Car (co-treat.)-treated cells, p < 0.001, ϯϯ significantly different from oAβ1-42 + Car (co-treat.)-treated cells, p < 0.05, ∫ significantly different from Aβ1-42 + Car (co-inc.)-treated cells, p < 0.001, ∫∫ significantly different from Aβ1-42 + Car (co-inc.)-treated cells, p < 0.05.

