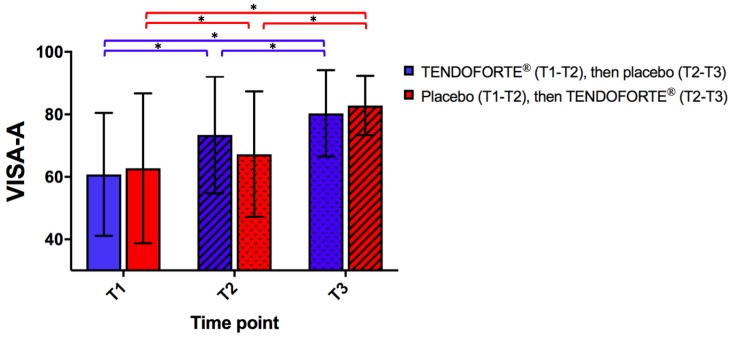
Figure 2.
Progression of the mean VISA-A scores during the course of the study Data represent mean ± SD. Statistical analysis of changes in VISA-A scores at baseline (T1), 3 months (T2) and 6 months (T3) via linear mixed modeling. p values ≤ 0.05 were considered statistically significant and marked with an asterisk.

