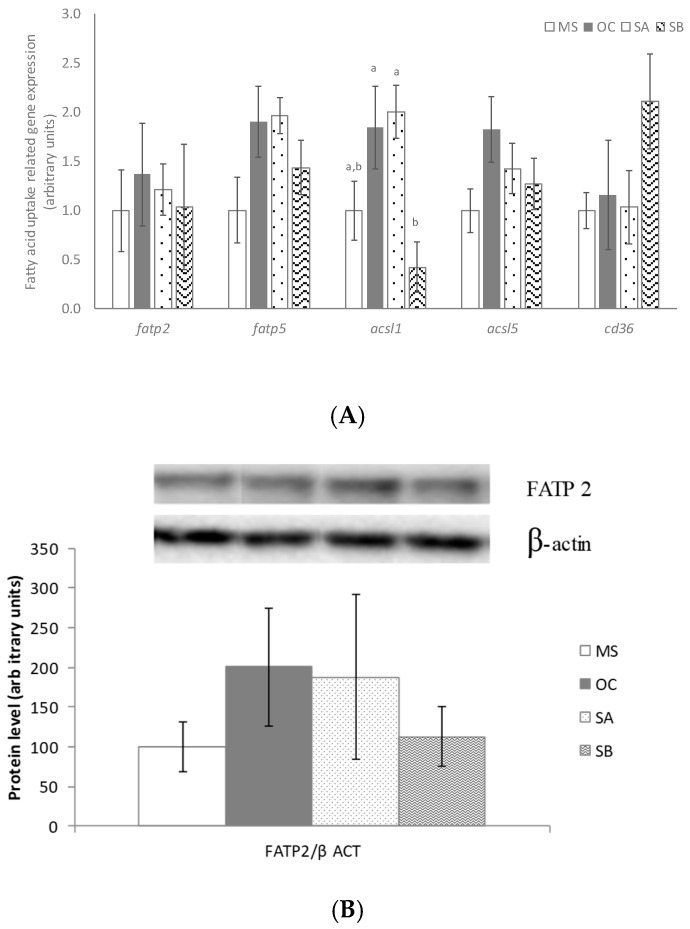
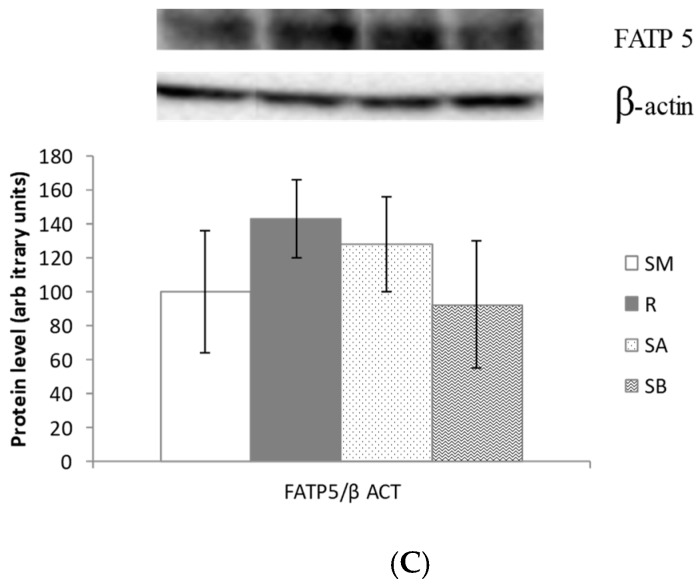
Figure 5.
Effects on fatty acid uptake of MetS rats (MS, n = 10), rats fed with wheat control diet (WC, n = 10), wheat and oat control diet (OC, n = 10), A snack (SA, n = 10), and B snack (SB, n = 10). (A) Fatty acid uptake involved genes mRNA levels, (B) FATP2 protein levels and (C) FATP5 protein levels. Values are expressed as mean ± SEM. Values not sharing a common letter are significantly different (p < 0.05). In the case of acsl1 gene expression, p value for the comparison between OC and SA vs. SB is p < 0.01.


