Figure 2.
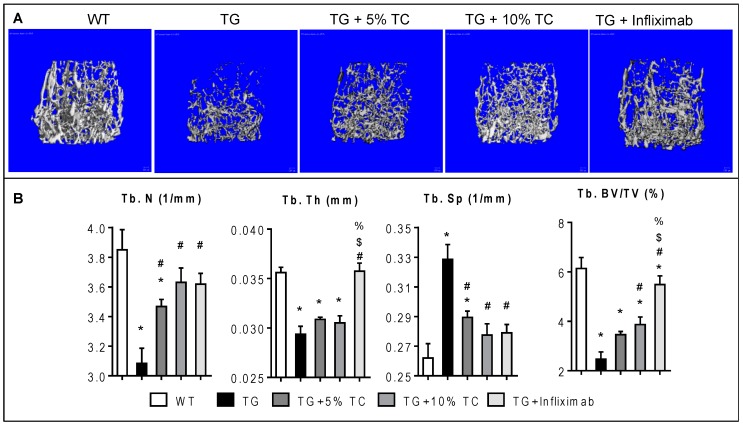
TC diet dose-dependently inhibited TNF-induced decline of trabecular bone mass. (A) Microcomputed tomography (µCT) scans representing metaphyseal trabecular bone were taken from the femurs of WT, TG, TG + 5% TC, TG + 10% TC, and TG + infliximab mice. (B) Trabecular number (Tb.N), thickness (Tb.Th), space (Tb.Sp), and bone mass (Tb.BV/TV) were quantified using µCT analysis. Values are mean ± SEM (n = 4–8 per group). *, p < 0.05 vs. WT; #, p < 0.05 vs. TG; $, p < 0.05 vs. TG + 5% TC; %, p < 0.05 vs. TG + 10% TC.

