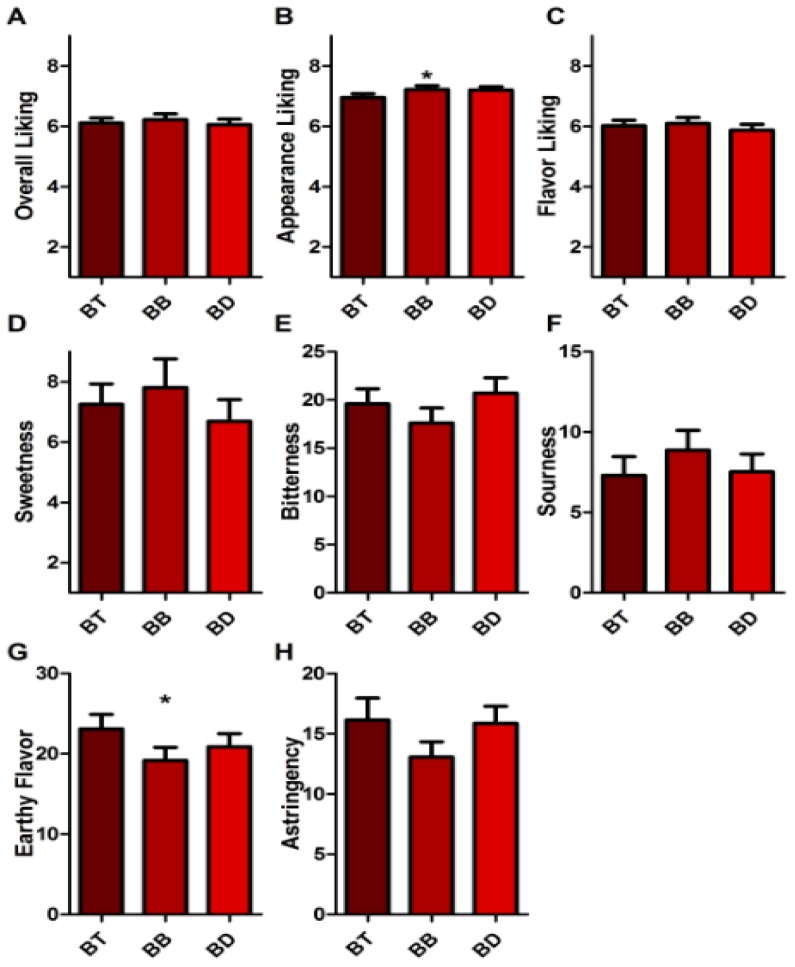
Figure 3.
Consumer perception of black tea brewed in tap (BT), bottled (BB), and deionized (BD) water. (A) Overall liking of samples, from dislike extremely (1) to like extremely (9). (B) Appearance liking of samples, from dislike extremely (1) to like extremely (9). (C) Flavor liking of samples, from dislike extremely (1) to like extremely (9). (D) Perceived sweetness of samples, rated on gLMS, scale descriptors no sensation (0.0), barely detectable (1.4), weak (6.0), moderate (17.0), strong (34.7), very strong (52.5), and strongest imaginable sensation of any kind (100.0). (E) Bitterness, scale as in D. (F) Sourness, scale as in D. (G) Earthy flavor, scale as in D. (H) Astringency, scale as in D. Bars display mean rating of panel (n = 103) plus SEM. * indicates p < 0.05.

