Figure 1.
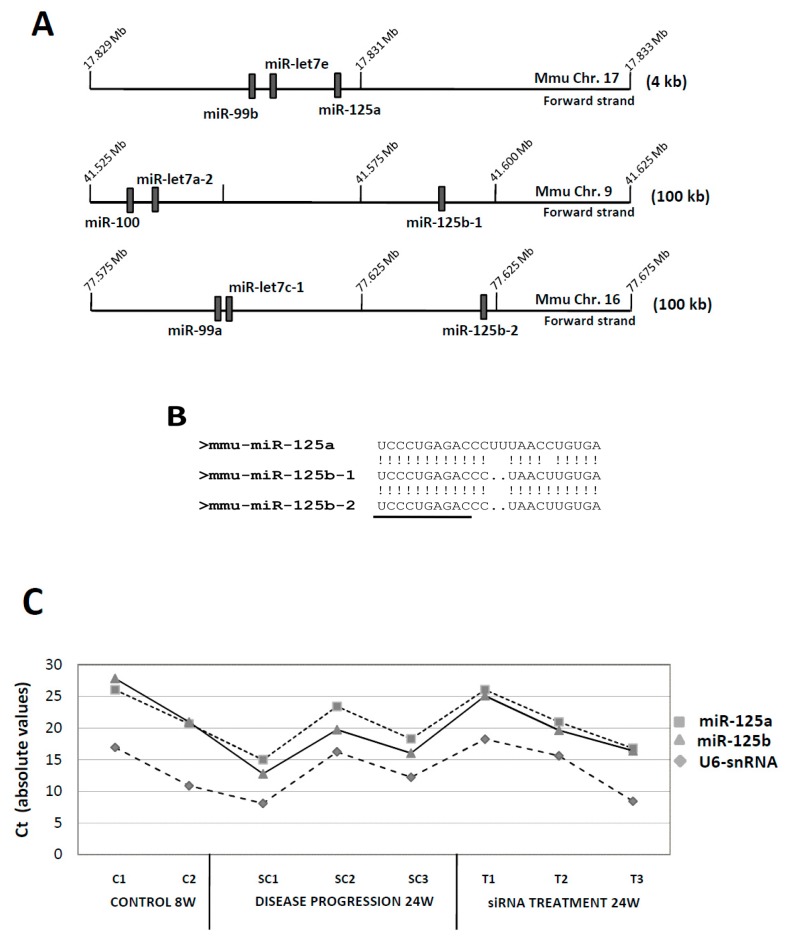
Structure and expression of the murine miR-125a/miR-125b-1/miR-125b-2 gene clusters in ATH progression. (A) Graphic diagram of the three miRNA gene clusters. miRNA gene locations (relative positions) were taken from the Ensembl genome browser [36]. Ensemble code for miR-125a was ENSMUSG00000065479, for miR-125b-1 was ENSMUSG00000093354, and for miR-125b-2 was ENSMUSG00000065472. Only miRNA genes and no other coding/non-coding genes are shown. Graphics (genomic regions and gene boxes) are not drawn to scale, and scales are different for each cluster (see numbering for absolute positions in the chromosome). Numbers to the right show the amount of genomic sequence covered by each graph. (B) Homology among miR-125a/miR-125b-1/miR-125b-2. Shown are the sequences of the mature miRNAs. (!) stands for a homologous nucleotide, while (.) stands for a deleted nucleotide. Underlined, the seed sequence. (C) Absolute expression (without normalization) of murine miR-125a, miR-125b and U6-snRNA (as normalizator) in control, basal samples (8W) in mice treated with the control SC-siRNA (24W, ATH progression) and in mice treated with the specific anti-CD40 siRNA (siRNA treatment, 24W). Shown are the Cts for each individual sample. Expression data was extracted from the original Taqman Low Density Array card (TLDA) experiment [25].

