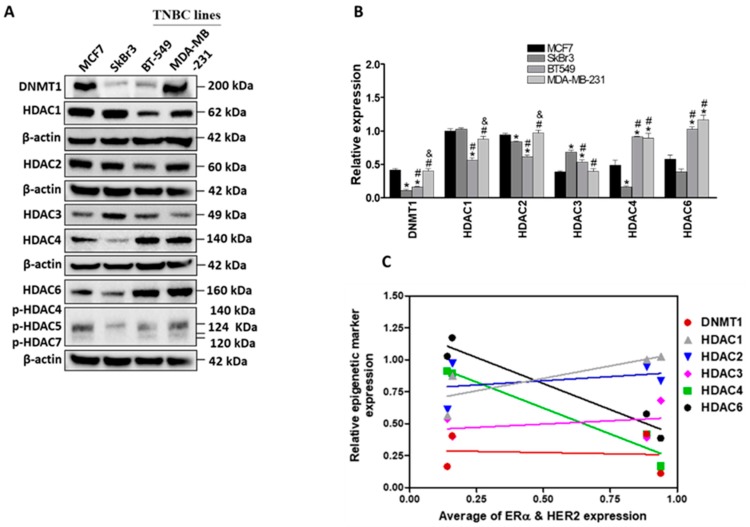
Figure 2.
Differential expression of DNA methyltransferases (DNMT)1 and histone deacetylases (HDACs) in breast cancer cells. (A) Immunoblotting of DNMT1 and different HDACs in MCF7, SkBr3, BT-549 and MDA-MB-231. DNMT1 and HDAC1 were visualized on the same blot, HDAC2, HDAC6 and phospho- HDAC4,5 and 7 were visualized on another blot whereas HDAC3 and 4 were visualized on a third blot (B) Quantification of band intensities of the indicated proteins. Each protein visualized on a blot was normalized to the corresponding β-actin as a loading control. (C) Correlations between the expression levels of ERα and HER2 and the expression levels of DNMT1, HDAC1, HDAC2, HDAC3, HDAC4 and HDAC6 in the indicated cell lines. Shown are the means ± SEM of at least three independent experiments. * p < 0.05 versus MCF7 cells, # p < 0.05 versus SkBr3 cells and & p < 0.05 versus BT-549 cells. Abbreviation: ns, not significant.

