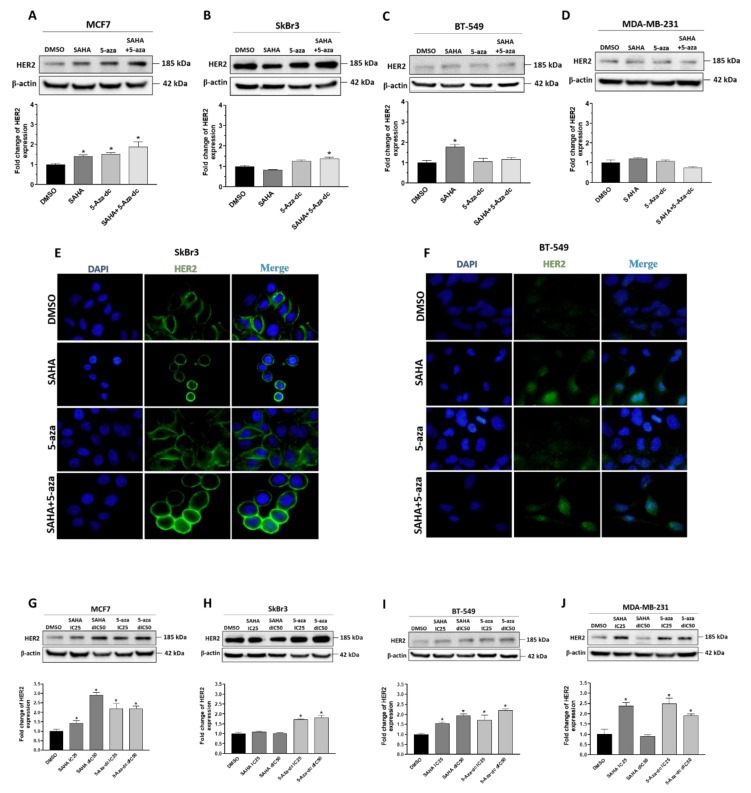
Figure 5.
Effect of SAHA, 5-aza-dc and their combination on the expression of HER2/ERBB2 in breast cancer cells. (A–D) Western blot analysis of HER2/ERBB2 expression in (A) MCF7, (B) SkBr3, (C) BT549, and (D) MDA-MB-231 cells after treatment with the IC50 concentrations of SAHA and/or 5-aza-dc. β-actin was used as a loading control. Lower panels: Bar graphs showing relative fold changes of HER2/ERBB2 expression after quantification and normalization to β-actin expression and DMSO treatment. (E,F) Representative micrographs of HER2/ERBB2 (green) and DAPI (blue) fluorescent signals at 100× magnification in (E) SkBr3 and (F) BT-549 cells treated with SAHA and/or 5-aza-dc. (G–J) Upper panels: Western blots for HER2/ERBB2 expression in (G) MCF7, (H) SkBr3, (I) BT549, and (J) MDA-MB-231 cells after treatment with IC25 or double IC50 (dIC50) concentrations of SAHA or 5-aza-dc. Lower panels: Bar graphs showing relative fold changes of HER2 after normalization to β-actin and DMSO treatment. Shown are the means ± SEM of at least three independent experiments. * p < 0.05 versus DMSO group.

