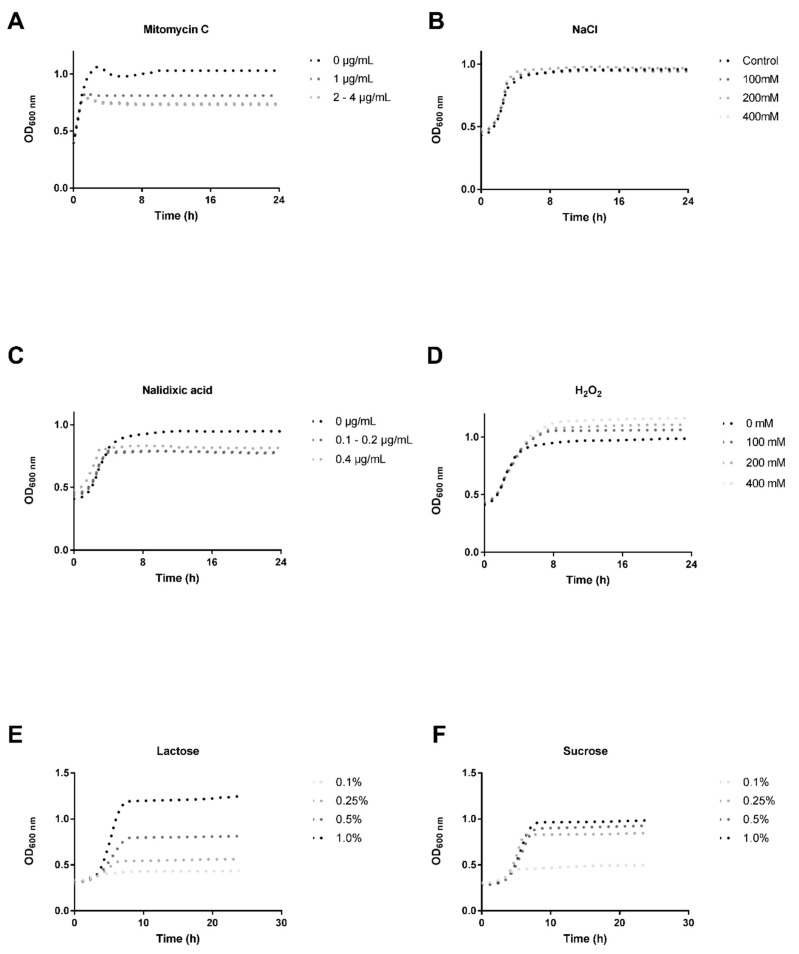
Figure 4.
Phage-induction evaluation performed using four different chemicals: (A) Mitomycin C (1–4 µg/mL); (B) NaCl (100, 200, and 400 mM); (C) Nalidixic acid (0.1, 0.2, and 0.4 µg/mL); (D) H2O2 (100, 200, and 400 mM); (E) Lactose (0.1, 0.25, 0.5, and 1.0% w/v); (F) Sucrose (0.1, 0.25, 0.5, and 1.0% w/v). The same legend was used for different concentrations of the MmC (2–4 µg/mL) and the Nalidixic acid (0.1–0.2 µg/mL), since these growth curves overlapped each other.

