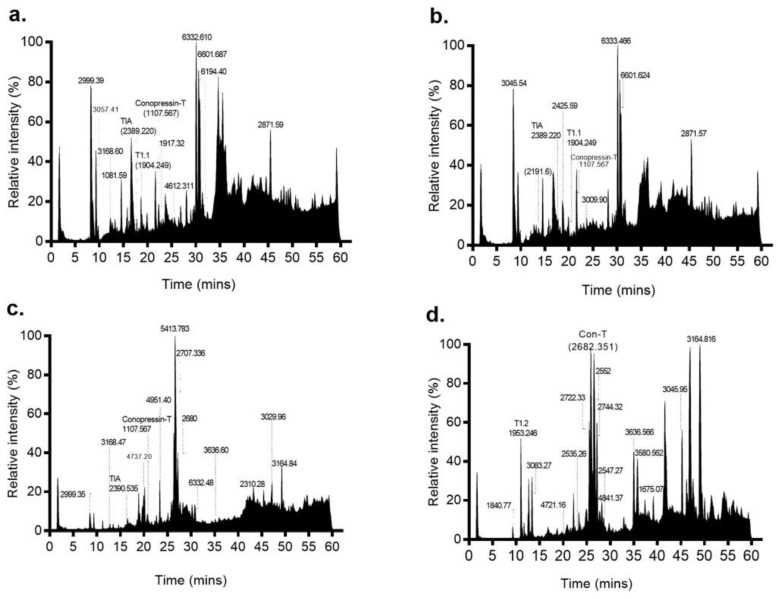
Figure 3.
Mass profiles of the four venom duct segments of C. tulipa. LC-MS profiles of (a) proximal, (b) proximal central, (c) distal central and (d) distal sections of the venom duct are shown, with prominent masses indicated. The mass profiles for the proximal and proximal central sections were similar and included three known conotoxins ρ-TIA (relative intensity 10.2%), T1.1 (relative intensity 0.17%) and conopressin-T (relative intensity 57.5%). In contrast, the mass profiles for the distal and distal central sections are quite different, with the latter displaying a much simpler peptide profile dominated by the peptide mass 5413.783 Da, while the distal section was dominated by Con-T (2682.351 Da) along with peptide masses 2722.33 Da, 2744.32 Da and T1.2. Additionally, relatively low expression of conopressin-T (4.45%) and ρ-TIA (0.1%) peptides was observed within the DC section.

