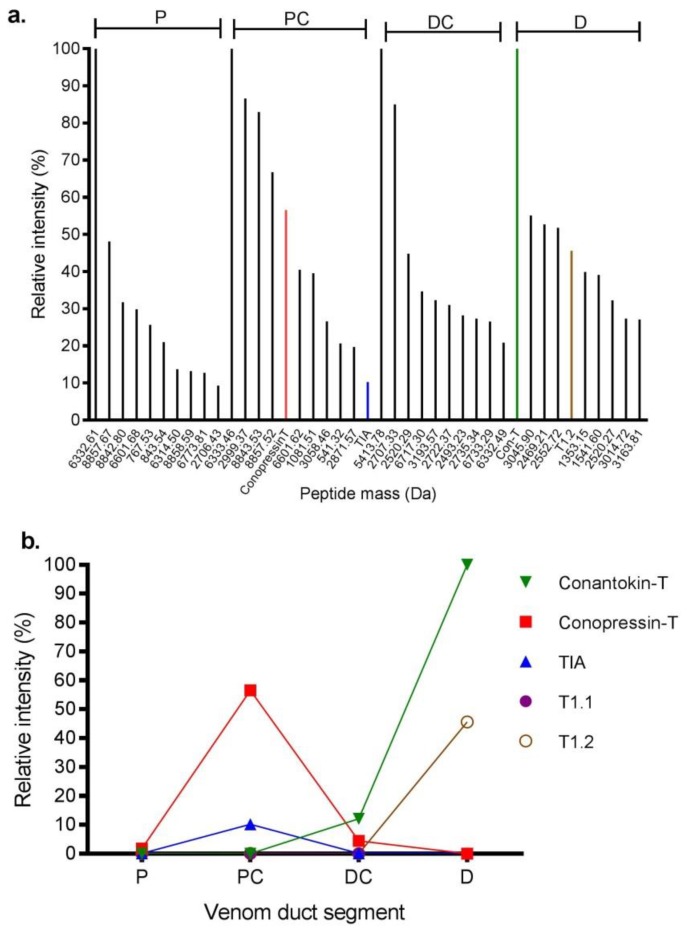
Figure 4.
Relative intensity of prominent venom peptides expressed in different sections of the C. tulipa venom duct. (a) Relative intensity of the ten dominant peptides from the proximal (P), proximal central (PC), distal central (DC), and distal (D) venom duct sections. Conopressin-T (red bar), ρ-TIA (blue bar) and conantokin-T (green bar) were amongst the major expressing peptides analysed in the proteome (b) Relative intensity of known C. tulipa peptide masses across the venom duct sections. Conantokin-T (2682. 3514 Da) dominated the D section, while conopressin-T (1107. 5675 Da) and ρ-TIA (2389.2206 Da) had relatively high expression levels in the PC sections. T1.2 (1953.2469 Da) also had relatively high expression in the D section, while T1.1 (1904.2497 Da) showed relatively low expression across the venom duct.

