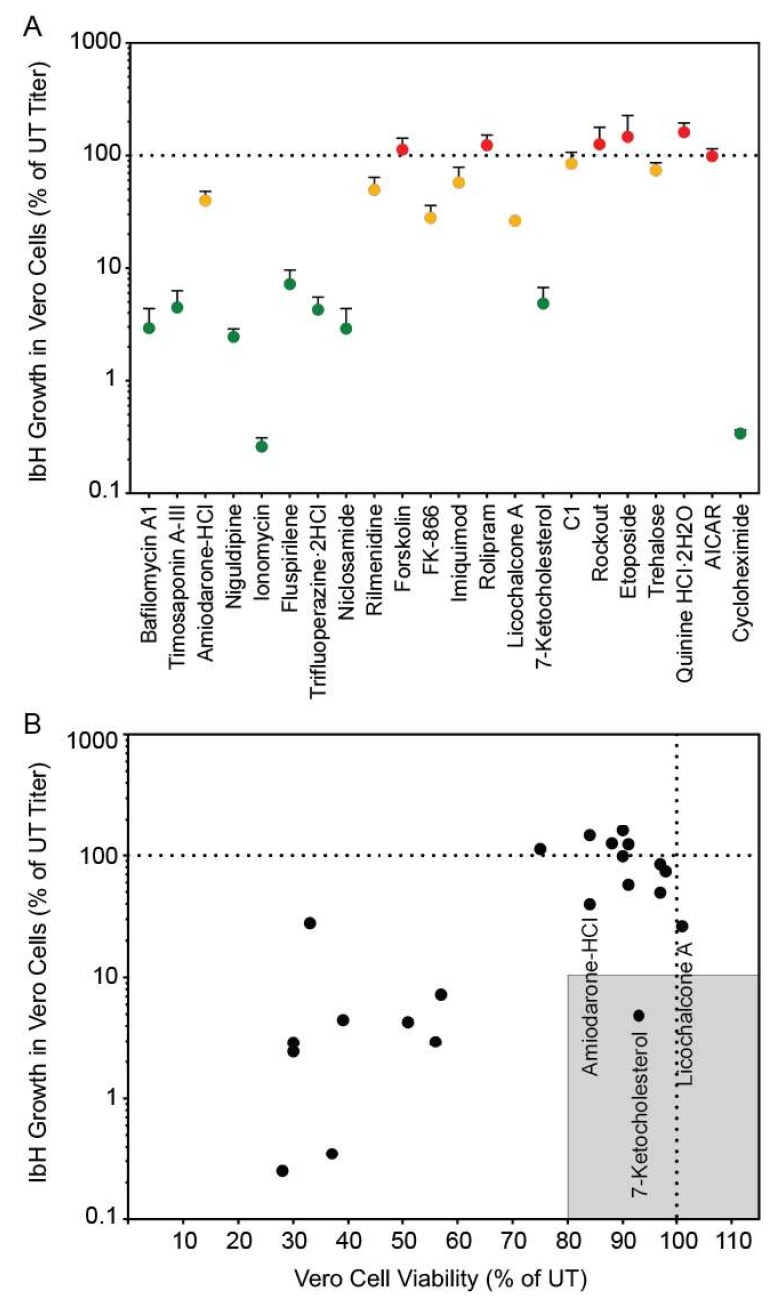
Figure 2.
African- lineage ZIKV IbH growth in compound-treated Vero cells as a percent of ZIKV titer in untreated Vero cells (A). The color-codes are the same as in Figure 1A. (B) ZIKV IbH growth in Vero cells versus viability of compound-treated Vero cells. The shaded box represents the zone in which ZIKV titer is reduced to 10% or lower than the untreated control and cell viability is at least 80% of control.

