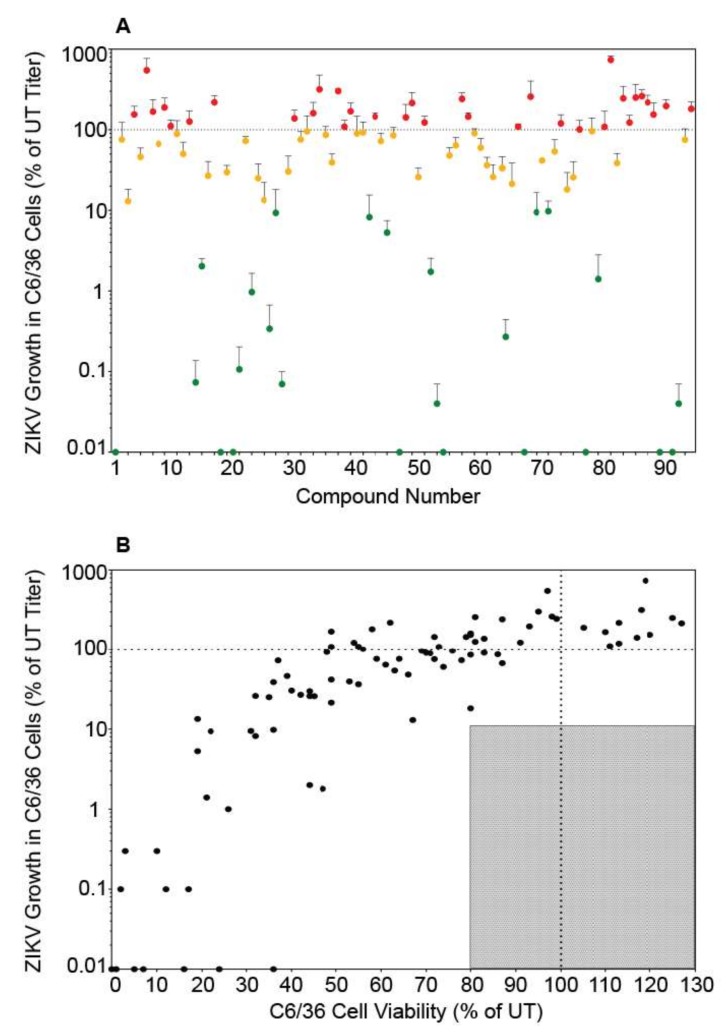
Figure 3.
Autophagy compound screen in C6/36 cells. (A) ZIKV growth in compound-treated C6/36 cells as a percent of ZIKV titer in untreated C6/36 cells. The labels and color-codes are the same as in Figure 1A. (B) ZIKV growth in C6/36 cells versus viability of compound-treated C6/36 cells. As in Figure 1, the shaded box represents the zone in which ZIKV titer is reduced to 10% or lower than the untreated control and cell viability is at least 80% of control. No compounds fit these criteria in C6/36 cells.

