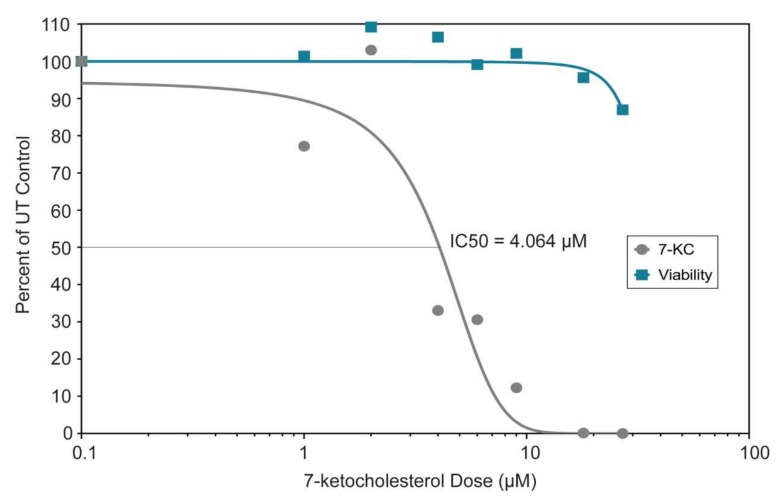
Figure 5.
Dose-response curve and viability of Vero cells treated with varying doses (0–27 µM) of 7-ketocholesterol. The curves were generated by GraphPad Prism version 7.04 using the log (inhibitor) vs. normalized response variable slope regression. The regression curve estimates the IC50 at 4.064 μM (R2 = 0.9078). The cell viability did not drop below 80% preventing us from determining the EC50.

