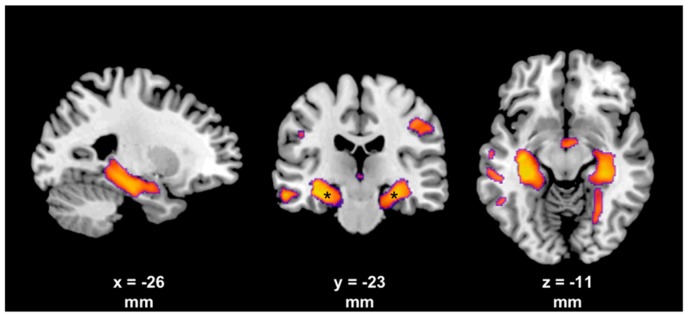
Figure 1.
T-score maps showing a smaller gray matter volume in long-term BoNT-treated CD patients compared to untreated CD patients. Results are illustrated at an exploratory threshold (voxel-wise p < 0.005, cluster size >100 voxel; * p < 0.05, FWE whole brain corrected on the cluster level) with the corresponding location within the MNI space indicated below.

