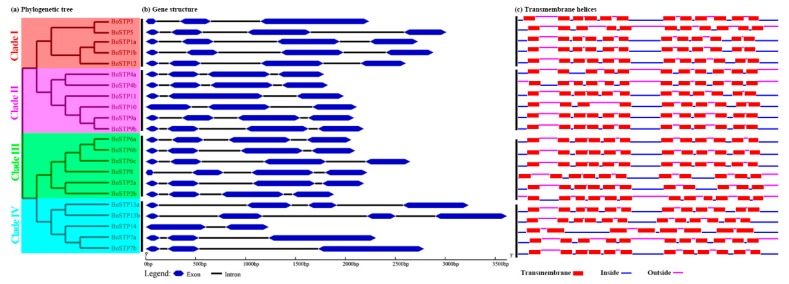
Figure 5.
Gene structures and transmembrane helices (TMHs) of BoSTP genes. (a) An unrooted phylogenetic tree was constructed based on the full-length amino acid alignment of all the BoSTP proteins using the maximum likelihood (ML) method. (b) Structures of BoSTP genes. Exons and introns are represented by blue double-sided wedges and black lines, respectively. (c) TMHs of BoSTP proteins. Red rectangles signify the transmembrane regions, blue and carmine lines indicate the intracellular and extracellular regions, respectively.

