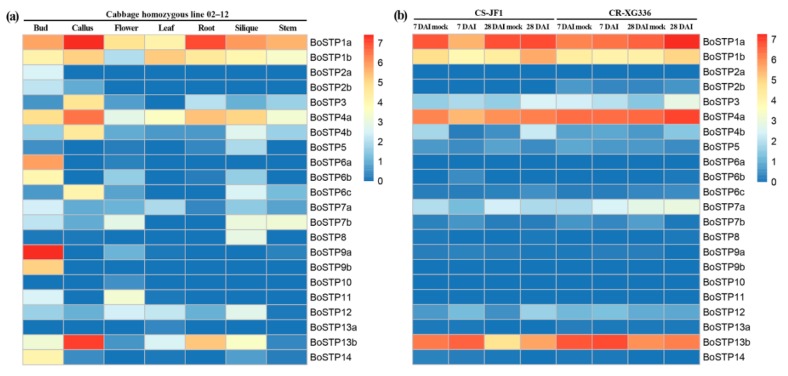
Figure 6.
Expression profiles of BoSTP genes. (a) Gene expression patterns of BoSTP genes in different organs (bud, callus, flower, leaf, root, silique, and stem). (b) Expression dynamics of BoSTP genes in cabbage roots following Plasmodiophora brassicae infection. Expression levels of the BoSTP genes are shown as the log2 transformed FPKM (fragments per kilobase of exon model per million mapped fragments) values obtained from the RNA-Seq data. DAI: days after inoculation.

