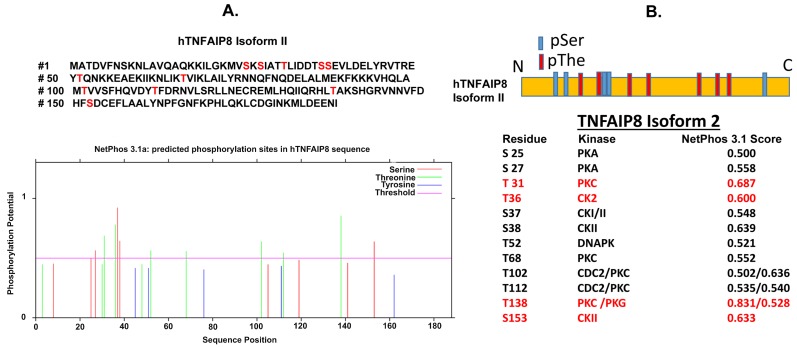
Figure 4.
(A,B) Prediction of phosphorylation sites of TNFAIP8 were performed by using NetPhos server 3.1 (http://www.cbs.dtu.dk/services/NetPhos/, accessed on: 15 July 2018) and Prosite search (https://prosite.expasy.org/, accessed on: 10 July 2018) (B) Locations of predicted pSer and pThe phosphorylation sites of TNFAIP8 isoform 2 are presented (upper schematic). Phosphorylation sites, associated kinases, and NetPhos scores are presented (lower table). Both NetPhos and Pro-site server-predicted phosphorylation sites and kinases are shown in red color (lower table). pSer—phospho-Serine. pThe—phospho-threonine.

