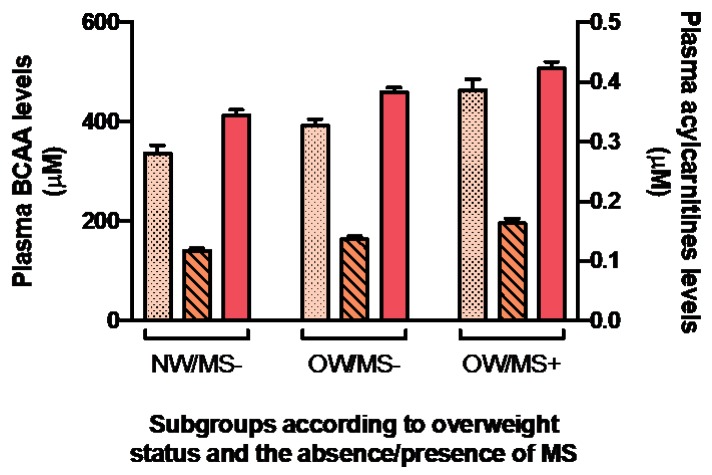
Figure 2.
Mean plasma concentrations of C3 and C5 ACs in relation with mean plasma BCAA levels between subgroups of NW/OW individual with or without MS. Plasma BCAA levels are shown in salmon; C3 ACs are shown in dotted light orange; C5 ACs are shown in striped medium orange. Whiskers represent standard error. Values presented are unadjusted. All mean values are significantly different (p < 0.05) between groups.

