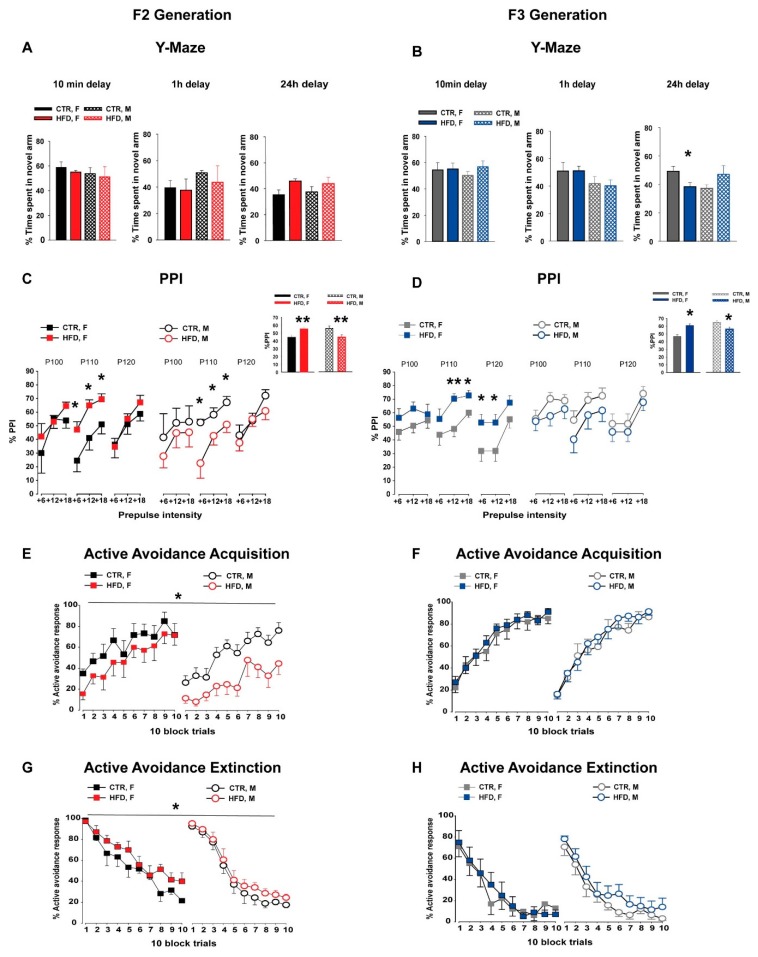
Figure 2.
Cognitive assessments in the F2 and F3 generations. (A,B) Working memory in the Y-maze. The bar plot depicts the percentage time spent in the novel arm during the 5-min test phase for three different delays. The percentage time spent in the novel arm was assessed by the ratio of time spent in the novel arm compared to the total time spent in all three arms. Three separate animal groups were used for each of the delays. In the F2 generation (A), N = [10 min delay: CTR (4M, 4F), HFD (4M, 4F); 1 h delay: CTR (4M, 4F), HFD (4M, 4F); 24 h delay: CTR (4M, 4F), HFD (4M, 4F)]. In the F3 generation (B), N = [10 min delay: CTR (4M, 4F), HFD (4M, 4F); 1 h delay: CTR (4M, 4F), HFD (4M, 4F); 24 h delay: CTR (6M, 6F), HFD (5M, 5F)]. (C,D) Prepulse inhibition (PPI) of the acoustic startle reflex. The line graph depicts the %PPI as a function of three different pulses (100, 110, and 120 dB) and the corresponding prepulse intensities (+6, +12, and +18 dB above the background 65dB) in the F2 (C) and F3 (D) offspring. The bar plot in the inset shows the comparison of the mean %PPI between the groups. N (F2 CTR) = (8 M, 8 F), N (F2 HFD) = (8 M, 8 F), N (F3 CTR) = (9 M, 10 F), N (F3 HFD) = (10 M, 10 F). (E–H) Two-way active avoidance learning. The line plot shows the percent active avoidance responses in successive 10-trial blocks during the acquisition phase (E,F) and the extinction phase (G,H) in both generations. N (F2 CTR) = (6 M, 6 F), N (F2 HFD) = (6 M, 7 F), N (F3 CTR) = (10 M, 10 F), N (F3 HFD) = (10 M, 10 F). All values are means ± SEM. * p < 0.05; ** p < 0.001; *** p < 0.0001. AA = active avoidance, HFD = high-fat diet, CTR = control diet, F = female, M = male.

